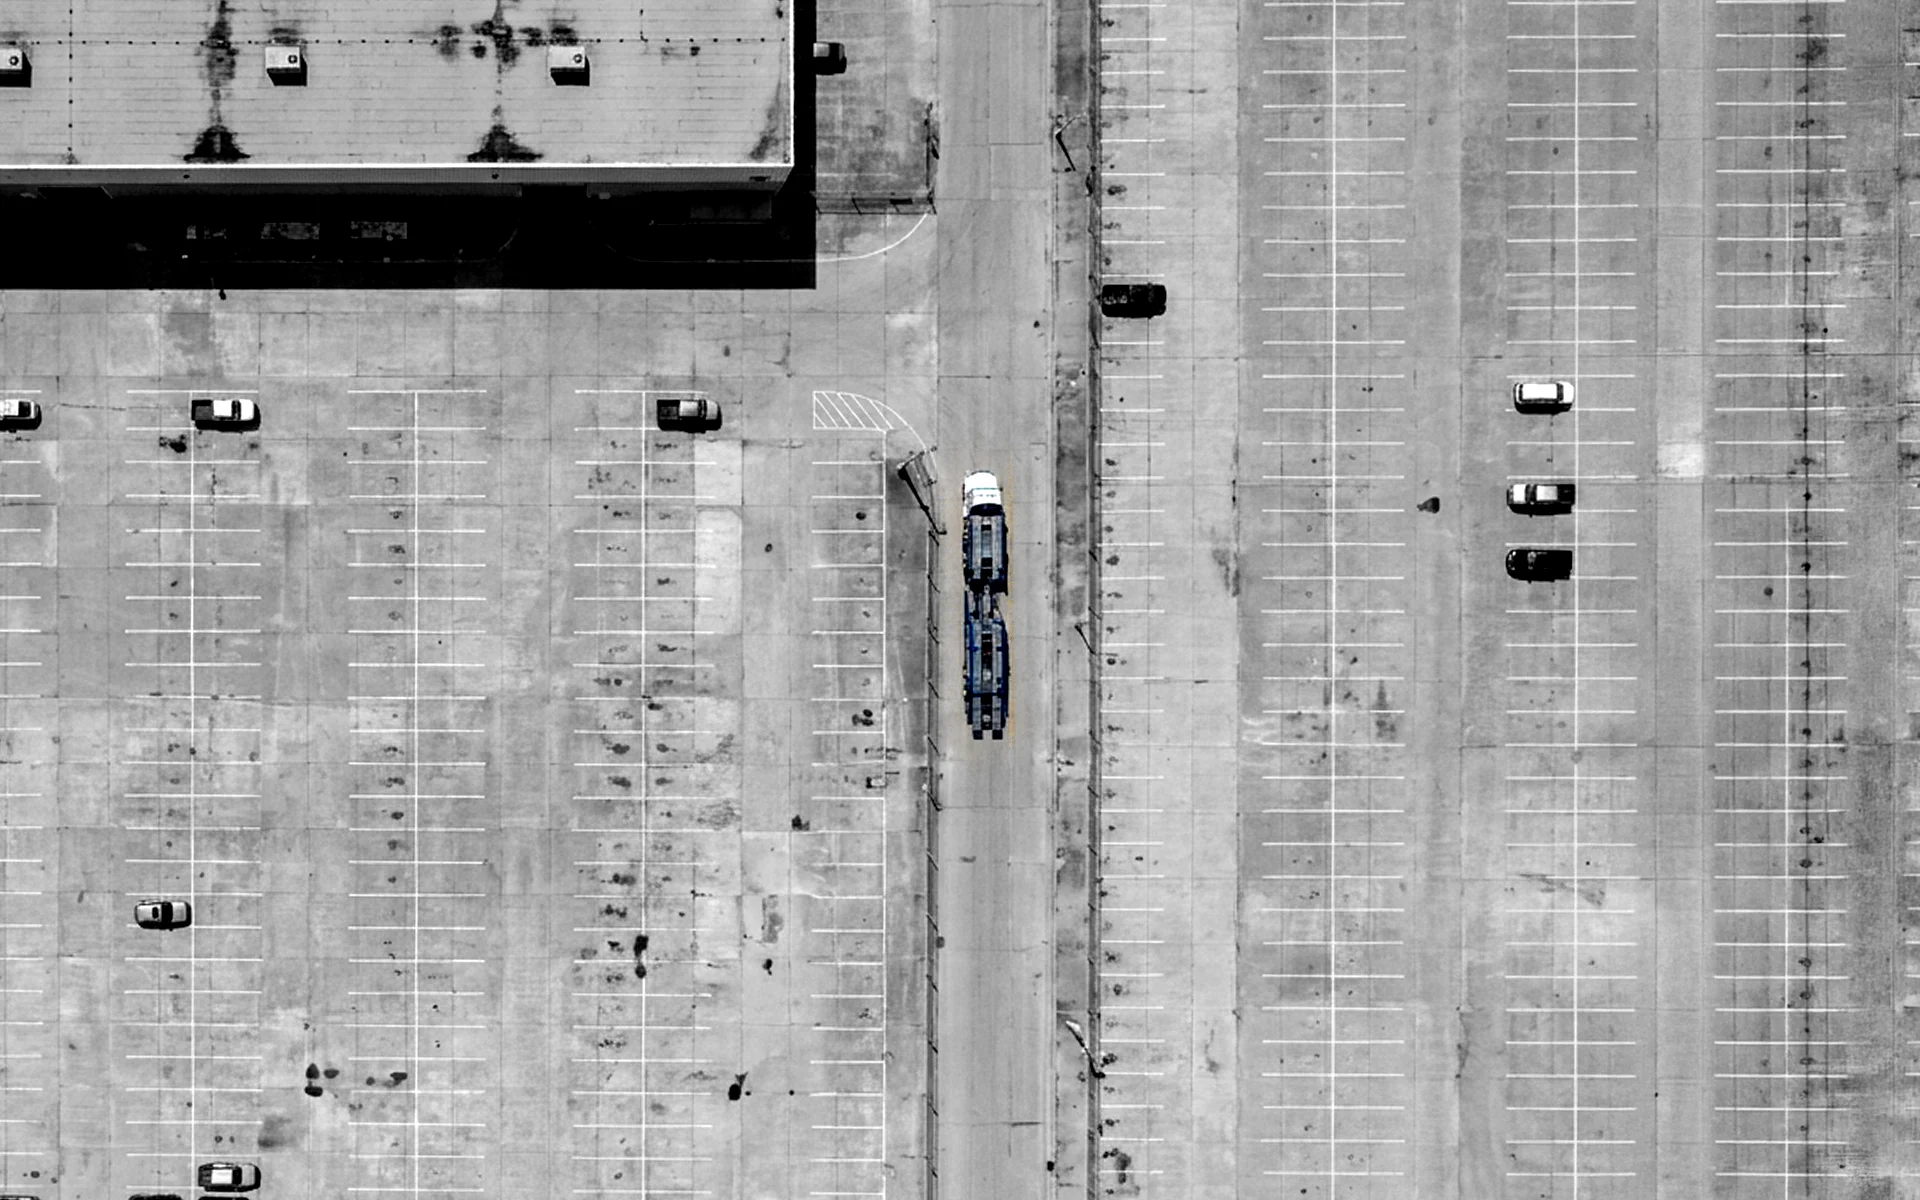
104 Matches, 11 Cities, 39 Days - The Fleet Logistics Challenge Behind FIFA 2026
The 2026 FIFA World Cup will run 78 matches across 11 U.S. cities over 39 days — landing squarely in the busiest period of the year for rental car demand.

The 2026 FIFA World Cup is not one event. It is 78 matches across 11 U.S. cities over 39 consecutive days, from June 11 through July 19 — the longest sustained demand surge the domestic rental car market has faced. If your fleet planning for this summer still looks like a slightly larger version of last July, you are not prepared for what the data is already signaling.
Standard seasonal planning assumes demand rises, peaks, and fades within a predictable window. FIFA 2026 does something different. It creates simultaneous demand spikes in geographically dispersed markets — markets separated by as much as 2,800 miles — that persist for weeks, not days. A vehicle surplus in Atlanta cannot be quickly redeployed to Dallas when both cities are hosting matches on the same afternoon.
And the supply side is tightening at exactly the wrong moment. Tournament-period bookings are up 298% year over year. The trucking industry just lost an estimated 194,000 drivers to a new federal regulation. Summer load volumes, already the highest of the year, will layer FIFA demand on top. The fleet operators who will capture the revenue opportunity this summer are the ones who started planning their transport logistics months ago. The ones still reacting will find a market that has moved without them.
The 2026 FIFA World Cup is the first to feature 104 total matches — a 62% increase from the 64-match format used in every tournament since 1998. Of those, 78 will be played in the United States across 11 host cities: Atlanta, Boston (Foxborough), Dallas (Arlington), Houston, Kansas City, Los Angeles (Inglewood), Miami, New York/New Jersey (East Rutherford), Philadelphia, the San Francisco Bay Area (Santa Clara), and Seattle. The competition window runs June 11 through July 19, with the Final at MetLife Stadium on July 19.
Visitor volume projections vary considerably. At the high end, a FIFA and World Tourism Organization analysis projects 6.5 million total attendees across all three host nations — the U.S., Mexico, and Canada. At the more conservative end, Tourism Economics estimates 1.2 million international visitors to the United States specifically, representing roughly one-third of all projected U.S. foreign visitors in 2026. The spread between these figures reflects genuine uncertainty: international tourism to the U.S. fell 6.3% in 2025, driven by negative perceptions of border and trade policy, new visa fees of up to $250 for certain travelers, and broader geopolitical tension. Airline reservations for host cities from European markets showed a 5% decline as of early February 2026 compared to the prior year.
Domestic demand tells a more bullish story. One analysis found that one in six Americans is planning a World Cup road trip. Short-term rental analytics firm Key Data reported tournament-period nights sold up 298% year over year by late 2025, with average daily rates rising 63%. After the official FIFA match draw on December 5, 2025, net reservations per property in host cities rose 29% year over year in the week immediately following, with Kansas City, Philadelphia, and Boston recording booking surges of 82%, 80%, and 78% respectively.
For fleet planning purposes, the conservative Tourism Economics figure — 1.2 million international visitors — is the operative baseline. But the domestic demand signal is the one that should anchor operational decisions. The Americans are coming regardless of geopolitics, and they are booking now.
It is tempting to treat FIFA 2026 as a scaled-up version of a familiar demand event. It isn’t. Six structural characteristics make this operationally distinct from anything the U.S. rental market has handled before.
Duration and persistence. A Super Bowl generates a demand spike measured in days. FIFA 2026 generates sustained elevated demand across multiple weeks in 11 separate markets. Fleet positioned for Opening Weekend still needs to be available — serviced, fueled, and compliant — three weeks into the tournament.
Multi-city simultaneity. The tournament runs concurrent matches across multiple host cities. Demand surges are not sequential — they occur simultaneously, which means regional fleet repositioning between host cities is constrained in real time. You cannot solve a shortage in one market by pulling from another when both are running hot on the same day.
Geographic distance. The 11 host cities span roughly 2,800 miles coast to coast. Inter-market repositioning at scale requires hauled transport, not driveaway — and hauling at those distances requires advance booking and route planning well before the event.
One-way rental asymmetry. FIFA fans frequently travel between cities as the bracket narrows, driving one-way rental patterns. Vehicles that begin the tournament at LAX may end up at DFW or IAH as group stages give way to knockout rounds. Without planned return logistics, fleet imbalances compound across weeks.
Peak summer overlap. The tournament window — mid-June through mid-July — is already the highest-demand period for domestic leisure travel. Rental companies cannot draw on slack from quiet shoulder seasons. Base demand is already elevated, and FIFA demand layers directly on top.
Staffing compression. High demand is only monetizable if sufficient staff exists to process returns, stage vehicles, and check out customers. As documented during Super Bowl LVII in Phoenix, vehicles can be physically present but operationally unavailable due to staff shortages — a distinction that carries direct implications for FIFA-scale operations across multiple locations simultaneously.
The historical record for major U.S. sporting events offers consistent patterns. The data points below are drawn from third-party reporting, government transportation studies, and industry publications.
Phoenix Sky Harbor International Airport documented a 50% rise in car rentals compared to a normal week, with more than 12,000 rental cars returned to the airport the Monday following the game — triple the typical daily return volume. The airport processed 180,000 passengers that Monday, versus an average daily count of approximately 110,000.
The lesson is in the return wave. A single-weekend event in one metro area produced a measurable rental fleet surge exceeding baseline capacity by 50%. The post-event return — 12,000 vehicles in a single day — was itself an operational peak. For a multi-week, 11-city event, those conditions will repeat across different markets over an extended period. Return logistics must be planned as formally as the outbound positioning.
Before the Super Bowl teams had even been confirmed, travelers at Sky Harbor were experiencing extended waits at rental facilities. Reports described low inventory, no walk-ins being accepted, and long lines at counters. The central problem was not a physical shortage of vehicles — it was a staffing shortage that prevented available vehicles from being staged and delivered efficiently.
The failure was a workforce deployment failure, not a fleet supply failure. At FIFA scale — multiple markets, multiple weeks, higher volumes — this distinction becomes a strategic risk. A fleet that is physically present but understaffed for check-out, staging, and returns is operationally compromised.
The 1984 Games are the most operationally instructive precedent for an auto-dependent, geographically dispersed event. Los Angeles had minimal public transit. Venues were spread more than 100 miles apart. Contemporary industry reporting noted that all major rental companies anticipated being sold out during the Games. Budget’s executive vice president stated publicly that the entire car rental industry would be sold out during that period. Hertz planned to hire at least 50 temporary employees; Dollar considered doubling its counter agent staff.
A transportation management evaluation by UC Irvine’s Institute of Transportation Studies documented that Los Angeles planners developed a two-year Transportation System Management plan to accommodate the expected 1.2 million visitors and 6 million spectators. The assessment: from a traffic management perspective, the Games were an unqualified success — a success built on two years of preparation, not two weeks.
Atlanta is the cautionary precedent. The 1996 Games were described as a transportation disaster in reporting prepared for subsequent Olympic host cities. Bus drivers got lost, athletes arrived moments before events, and overloaded trains failed to get residents home. A Department of Defense transportation advisory issued before the Games predicted no rental cars available and warned that up to 600,000 additional people per day would be in the Atlanta area.
The conditions cited — insufficient planning lead time, underinvestment in transportation infrastructure, overreliance on improvised solutions — are conditions that apply with equal force to rental fleet planning that does not begin until the event approaches.
The last time the U.S. hosted the World Cup, hotel revenue per available room in host cities rose 11.9% during June and July. The current 2026 forecast from CoStar and Tourism Economics projects 12.7% RevPAR growth for host markets — comparable in magnitude, but with different underlying drivers and more geopolitical headwinds. The demand intensity is likely real. The level of international attendance may be lower than 1994-equivalent models project.
The pattern across these events is consistent: success correlates with planning lead time. The 1984 LA Olympics succeeded with a two-year horizon. The 1996 Atlanta Olympics failed with reactive, last-minute logistics. The 2026 World Cup is closer to 1984 LA in geography and automobile dependency. The planning rigor required is comparable.
Most of the coverage around FIFA 2026 fleet planning focuses on demand projections and pricing. There is significantly less attention being paid to a more fundamental question: will the auto transport capacity needed to reposition vehicles into host city markets actually be available?
The U.S. auto transport market is experiencing structural constraints that make 2026 a harder booking environment than any recent year. Several factors are converging simultaneously.
Driver supply tightening. The American Trucking Associations estimated the industry was short 60,000 to 80,000 drivers in 2025. The Bureau of Labor Statistics revised its employment data in February 2026 to show that 122,000 trucking positions had quietly exited the workforce since October 2022. The pipeline is not replenishing at the rate positions are being lost.
FMCSA non-domiciled CDL restrictions. The Federal Motor Carrier Safety Administration (FMCSA — the federal body that regulates commercial trucking) issued a final rule on February 13, 2026, effective March 16, that restricts non-domiciled CDL (Commercial Driver’s License) holders by requiring vetted employment authorization and mandating state verification through the SAVE system. The agency’s own estimates suggest this rule will push approximately 194,000 drivers out of the market. Werner Enterprises’ CEO publicly described this as the biggest structural change to U.S. carrier capacity since deregulation.
Carrier fleet contraction. Truckload carriers culled their fleets through a prolonged freight downturn and have restructured toward dedicated contracts rather than spot market capacity. The highway Class 8 tractor population continues to contract, and driver supply is tightening at its fastest pace in several years.
Summer peak amplification. The FIFA tournament window is already the busiest period for consumer auto transport demand — summer moves, college relocations, and seasonal vehicle repositioning all concentrate in this window. Load volumes during peak seasons in standard years rise 30–50%. A competitive demand event layered on top of that baseline will further tighten availability and rates.
The practical implication is straightforward: open carrier capacity into FIFA host city markets during May and June 2026 is likely to be among the most contested in the auto transport market in years. Rental companies that have not secured capacity commitments well in advance will face a constrained spot market at elevated rates — or insufficient carrier availability entirely.
This is the variable most fleet managers are underweighting. Demand forecasting and pricing strategy get the attention, but the physical ability to move vehicles across the country at the scale and timing required depends on a carrier market that is structurally tighter than it has been for any prior mega-event on U.S. soil. Watching demand signals without watching carrier capacity is seeing half the picture.
For fleet-scale repositioning — hundreds of vehicles across multiple corridors under time pressure — carrier selection is not a procurement exercise. It is an operational risk decision. The criteria below apply to any large-volume engagement, but carry particular weight when capacity is constrained and timing is compressed.
FMCSA compliance. Every interstate carrier must hold active operating authority from the FMCSA, maintain a current DOT number, and carry a valid Compliance, Safety, Accountability (CSA) score. Carriers with elevated CSA scores face potential audit triggers, higher insurance premiums, and reduced reliability. Verify active authority status through FMCSA’s SAFER database before contracting.
Insurance coverage. FMCSA regulations require vehicles transporting other vehicles to carry a minimum of $1,000,000 in public liability insurance. Fleet-scale engagements should also confirm cargo insurance, physical damage coverage for the trailer and tractor, and current certificates obtained before any vehicles are tendered.
Written capacity commitments. For events of this scale, verbal commitments are insufficient. Seek written commitments specifying minimum number of loads per week, route coverage, vehicle type specifications — open versus enclosed, load capacity — and scheduling flexibility windows. A carrier that cannot provide written commitments is, in effect, a spot market vendor. That is exactly what to avoid during a capacity-constrained peak period.
Route coverage and equipment match. Not all carriers run all corridors. A carrier strong in Southeast-to-Northeast lanes may lack coverage on West Coast or Central corridor routes. Map your expected repositioning flows against carrier route networks before finalizing partner selection.
Communication and tracking. At scale, real-time visibility into in-transit fleet location is operationally necessary. Partners should provide load-level tracking, estimated delivery windows, and proactive notification of delays. For asset-based carriers — companies that own their equipment and employ their drivers — this visibility is a function of direct operational control. For brokers relying on third-party carriers, tracking quality depends on systems they do not own.
Rental fleet experience. Carriers that specialize in rental fleet repositioning understand the operational context: airport access and security requirements, consolidated rental car facility (CRAC) procedures, branch hours, and the urgency of getting vehicles into service. Carriers with documented rental fleet experience will deliver more efficiently than general-purpose haulers being recruited for the first time.
GB Cargo is an asset-based auto transport carrier headquartered in West Lafayette, Indiana. We own our equipment and employ our drivers — we are not a broker. Our fleet runs on new equipment, and every client works with a dedicated account manager — a named point of contact, not a rotating dispatch queue. Our customer portal provides real-time tracking for every vehicle in transit, from pickup to delivery. We serve car rental companies, dealerships, OEMs, auctions, and fleet operators nationwide. We prefer long-term contracted partnerships with defined capacity commitments over spot-market transactions — the kind of relationship that matters most when carrier capacity is at a premium.
Working backward from June 12 — the first U.S. match — the critical preparation window for fleet repositioning was approximately October 2025 through March 2026. Some of the decisions below are no longer recoverable. What follows is both a record of what should have happened and a map of what must happen now.
12–18 months out (September–December 2024). Fleet expansion decisions scoped. Capital planning for surge vehicle acquisition submitted. Initial discussions with preferred auto transport carriers to signal upcoming volume. Internal planning for staffing increases in host city markets — temporary employee pipelines are built over quarters, not weeks.
9–12 months out (January–March 2025). Vehicle orders placed for fleet expansion with June delivery targets. Order-to-delivery windows of 15–20 weeks meant orders placed by Q1 2025 would be available for staging by May–June 2025. Carrier capacity discussions formalized — written commitments for May–June load volumes on host-city-bound corridors locked. Host city mobility plans due from FIFA host committees by March 2025; Kansas City signed a 200-bus lease on February 28, 2025, signaling ground transportation demand patterns.
6–9 months out (October–December 2025). The FIFA match draw on December 5, 2025, sharpened market-level demand profiles. Which cities host high-profile matches became known, enabling refined allocation of surge fleet. Vehicle pre-positioning strategy finalized by market, date, and vehicle class with transport moves scheduled against carrier commitments. Facility coordination with airport CRAC operators confirmed.
3–6 months out (January–April 2026). New vehicle deliveries arriving against OTD commitments. Auto transport moves begin for the most distant corridors. At 7–14 days transit time per cross-country move, and with carrier scheduling lead time, first loads should depart by April at the latest for June 12 availability. Incremental hiring finalized; temporary staff onboarded and trained. Some model-year 2026 order cutoffs have already passed — at least one major fleet acquisition provider noted a Stellantis MY26 Chrysler minivan order cutoff of January 28, 2026.
4–8 weeks out (April–May 2026). Bulk of fleet repositioning moves executing via contracted haulers. Fleet already in host city markets being conditioned for tournament readiness. Airport facility pre-positioning meetings to confirm overflow parking and staging areas. Contingency carrier capacity identified for last-minute additions — recognizing that spot market rates will be significantly elevated.
Where delayed action leads. For any company still planning to acquire net-new vehicles for tournament use, the practical window for OEM-built units has closed or is closing. Alternatives include used vehicle acquisition, short-term fleet leasing, or peer-to-peer fleet agreements. Companies that have not secured hauler commitments are competing for capacity in an already-constrained summer market at premium rates. Large-scale temporary hiring for June needs at least 60–90 days of lead time. Organizations without temporary staff pipelines activated now will face operational gaps.
If the planning timeline above suggests your organization is behind, the following priorities represent the highest-impact actions still available. They are drawn from the operational and market data presented in this article.
1. Map your current fleet position against host city demand. Identify which host markets are currently under-fleeted relative to projected June–July demand and quantify the gap by vehicle class. The top five U.S. host cities account for 52% of projected tournament visitor spending, with East Rutherford/NJ, Inglewood/LA, Arlington/TX, Atlanta, and Seattle leading.
2. Audit your transport partnerships immediately. If you do not have written capacity commitments from auto transport carriers for May–June moves into host city markets, begin those conversations today. Capacity is tightening and summer peak season compounds FIFA demand. Accept that rates will be above prior-year benchmarks.
3. Apply the 300-mile decision threshold. For repositioning moves under approximately 300 miles, driveaway may be cost-effective. For anything beyond that distance, professional car hauling is the economically rational approach. A single open carrier moving 7–10 vehicles per trip cuts per-vehicle labor cost, eliminates multi-driver coordination, and preserves vehicle condition. For cross-country repositioning at FIFA scale, hauling is the only practical option.
4. Plan the return leg explicitly. The Monday following the 2015 Super Bowl, 12,000 rental cars returned to Phoenix Sky Harbor in a single day. FIFA 2026 will produce return surges across multiple markets as national teams are eliminated and fan groups depart. Apply the same formal logistics planning to the return wave as the pre-event positioning. Pre-negotiate return-leg backhaul into carrier contracts — carriers who can run loaded outbound and inbound are more economically motivated to honor rate commitments.
5. Verify facility capacity. Vehicles that arrive at a branch that cannot stage, fuel, and release them efficiently are not available fleet — they are a logistics problem. Coordinate with airport CRAC operators and branch managers on capacity ceilings well ahead of tournament week.
6. Build vehicle mix into positioning plans. International visitors and domestic leisure travelers at a global event skew toward SUVs and minivans for group travel. A repositioning plan that moves economy cars to host cities while SUV inventory stays at origin markets will underperform against demand.
7. Vet every carrier against FMCSA compliance. Use the FMCSA SAFER database to verify active authority, current insurance certificates, and CSA score before any vehicles are tendered. For fleet-scale engagements, obtain cargo insurance certificates as part of the contracting process. Compliance verification is not optional — it is the first filter in carrier selection.
How far in advance should rental companies book auto transport for FIFA 2026 fleet repositioning?
Fleet-scale transport programs for major events require three to six months of advance engagement at minimum. For individual consumer shipments, standard booking lead time is two to three weeks for routine moves or three to six weeks during summer peak season — but those individual windows are entirely insufficient for multi-load, multi-route programs. As of spring 2026, companies that have not yet begun carrier conversations should treat this as an urgent priority, understanding that premium rates and constrained options are the current market reality.
How many vehicles can a single car carrier move per trip?
A standard open car carrier typically moves 7–10 vehicles per trip, depending on equipment type and vehicle weight mix. The practical capacity per load is governed by the 80,000-pound federal gross vehicle weight limit. For a rental company repositioning hundreds of vehicles over long distances, hauled transport is significantly more efficient than individual driveaway — both in per-vehicle cost and in reducing the number of drivers and coordination required.
What is the FMCSA non-domiciled CDL rule and how does it affect auto transport capacity in 2026?
The FMCSA issued a final rule on February 13, 2026, effective March 16, that restricts non-domiciled CDL holders by requiring vetted employment authorization and mandating state verification through the SAVE system. The agency estimates this rule will push approximately 194,000 drivers out of the market. Combined with an existing industry driver shortage of 60,000–80,000 and ongoing carrier fleet contraction, the rule further tightens available auto transport capacity during what was already projected to be the most competitive summer booking period in years.
FIFA 2026 is not a demand spike. It is a 39-day operational stress test across 11 markets, arriving in a carrier environment that is structurally tighter than any prior mega-event on U.S. soil. The demand data is clear — 298% booking surges, 12.7% projected RevPAR growth in host cities, domestic travel intent that appears largely insulated from the geopolitical factors tempering international attendance.
But the less visible constraint is the one that will determine operational outcomes: auto transport capacity. The trucking market has fewer drivers, tighter fleets, and a new federal rule that just removed an estimated 194,000 CDL holders from the workforce. The companies that will capture the revenue opportunity this summer are the ones that treated transport logistics as a strategic planning function months ago — not the ones discovering in June that the trucks are not available.
If your fleet repositioning plan for June–July 2026 does not yet include confirmed auto transport capacity commitments with defined routes and schedules, that conversation needs to happen now — not next month. The carrier market is not waiting, and the window for pre-committed capacity at reasonable rates is narrowing by the week.
For rental fleet operators looking to discuss contracted transport capacity for summer 2026 and beyond, reach out to our team to start the conversation.
Stay informed on the latest news and insights from GB Cargo.