Rail Moves 75% of New Vehicles. Trucks Take 60% of the Revenue. Here's Why.
Rail captures 75% of U.S. vehicle volume but trucks command 60% of FVL revenue. The real cost of the modal split, from a final-mile carrier's view.
Rail moves three out of every four new vehicles sold in the U.S. — but it's not the cheaper option in every situation that matters.
For fleet managers, dealership operations directors, and auction coordinators, the rail-vs-truck call is usually framed as a per-ton-mile math problem. That framing misses where the cost actually lands. We see it from the final-mile side every week: shipments that look cheap on paper arrive late, get damaged in transit, or sit in a rail terminal long enough to miss a dealer window — and the savings disappear into floor plan financing and lost selling days.
Here is the gap that signals the real story. Rail captures roughly 75% of U.S. light vehicle volume, but trucks command over 60% of the $64.5 billion finished vehicle logistics market. That inversion isn't an accident. It's the clearest evidence that per-mile cost isn't where the modal decision should rest — and that the variable most B2B buyers optimize on is not the variable that drives their downstream cost.
The U.S. finished vehicle distribution map is shaped by a geographic mismatch. Production is concentrated. Consumption is dispersed.
Over the past three decades, North American auto manufacturing has migrated from the Upper Midwest into a long corridor — often called "Auto Alley" — that runs from Michigan down through Kentucky, Tennessee, Alabama, and Texas, then into northern Mexico. Roughly 18,000 franchised dealerships are spread across all fifty states. The math of moving millions of finished vehicles from a narrow production band to a continental retail footprint is what forces the modal split.
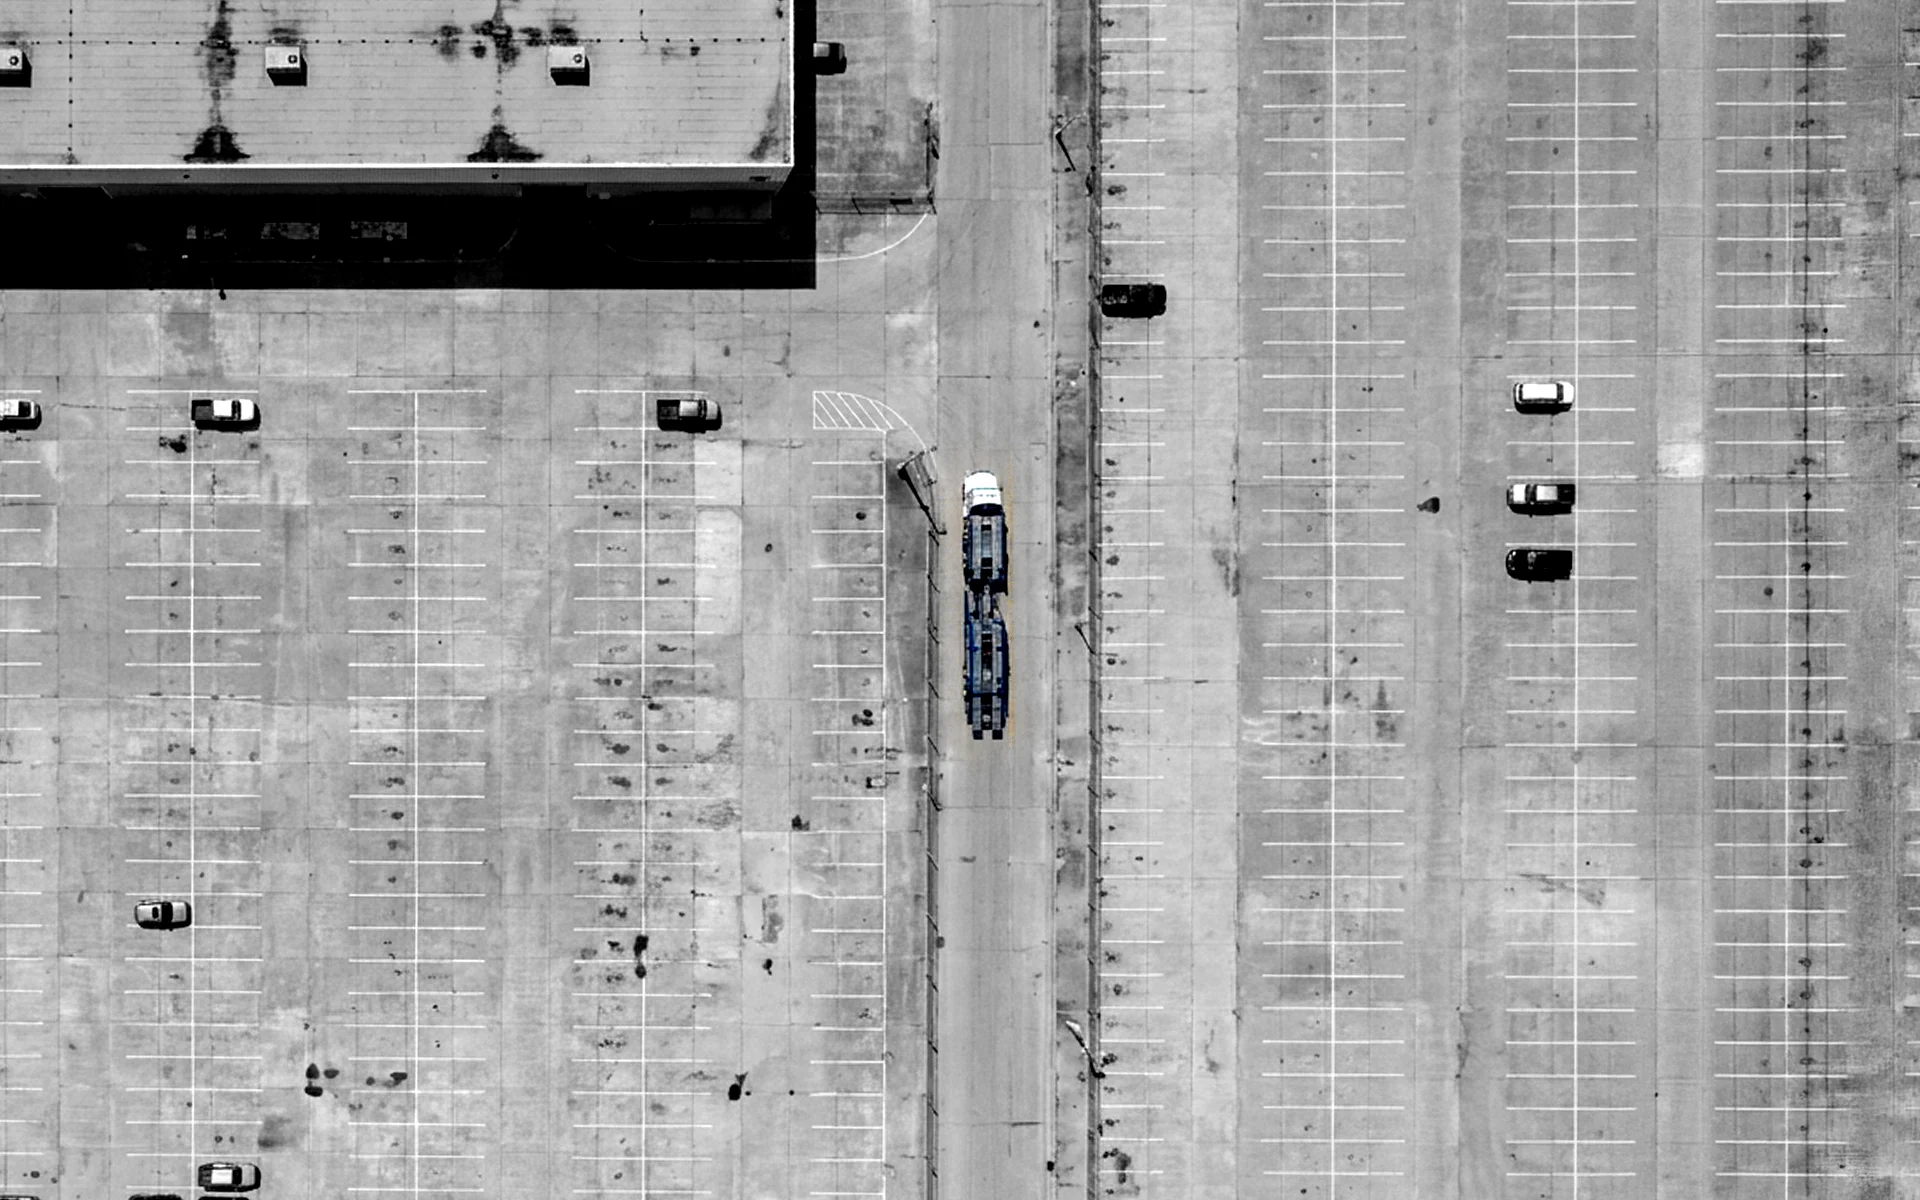
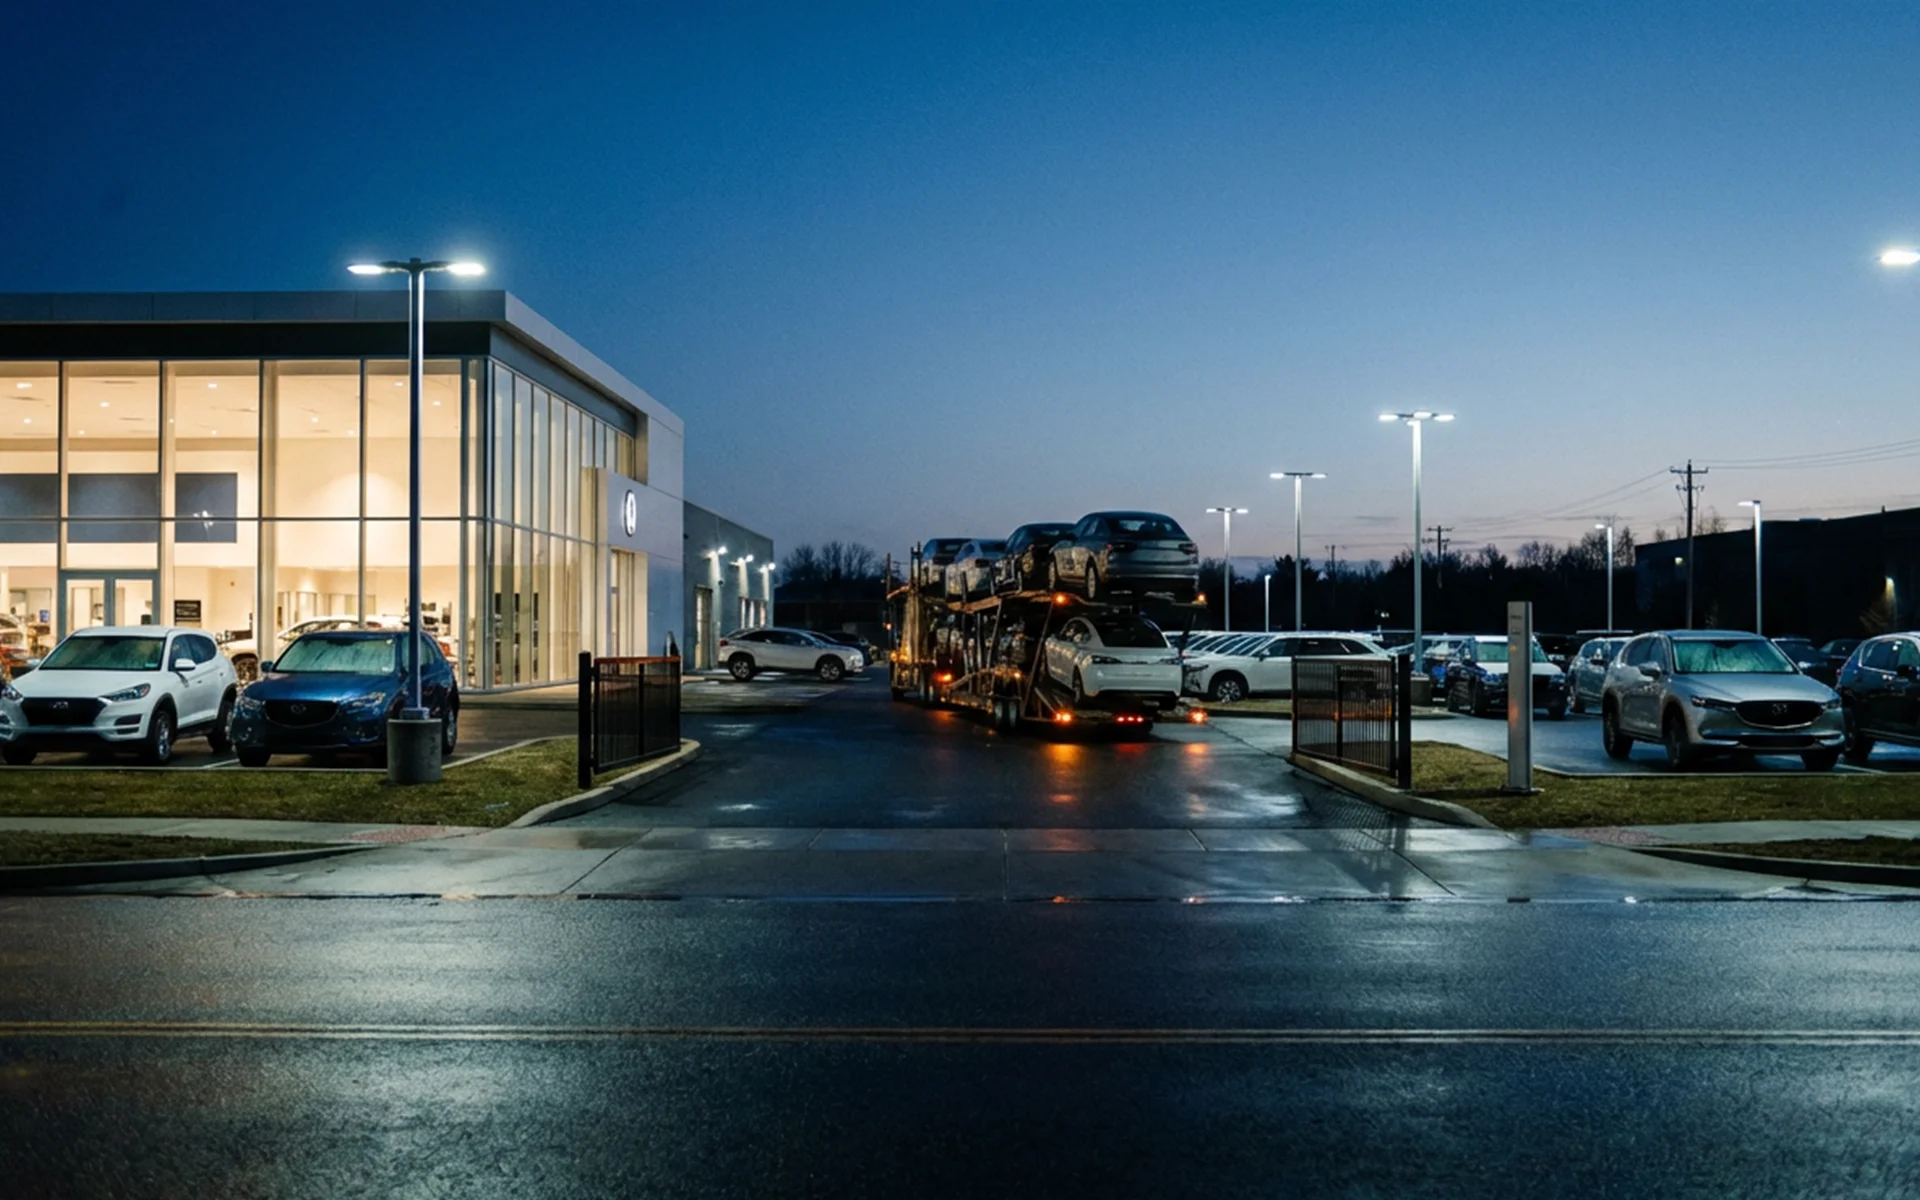
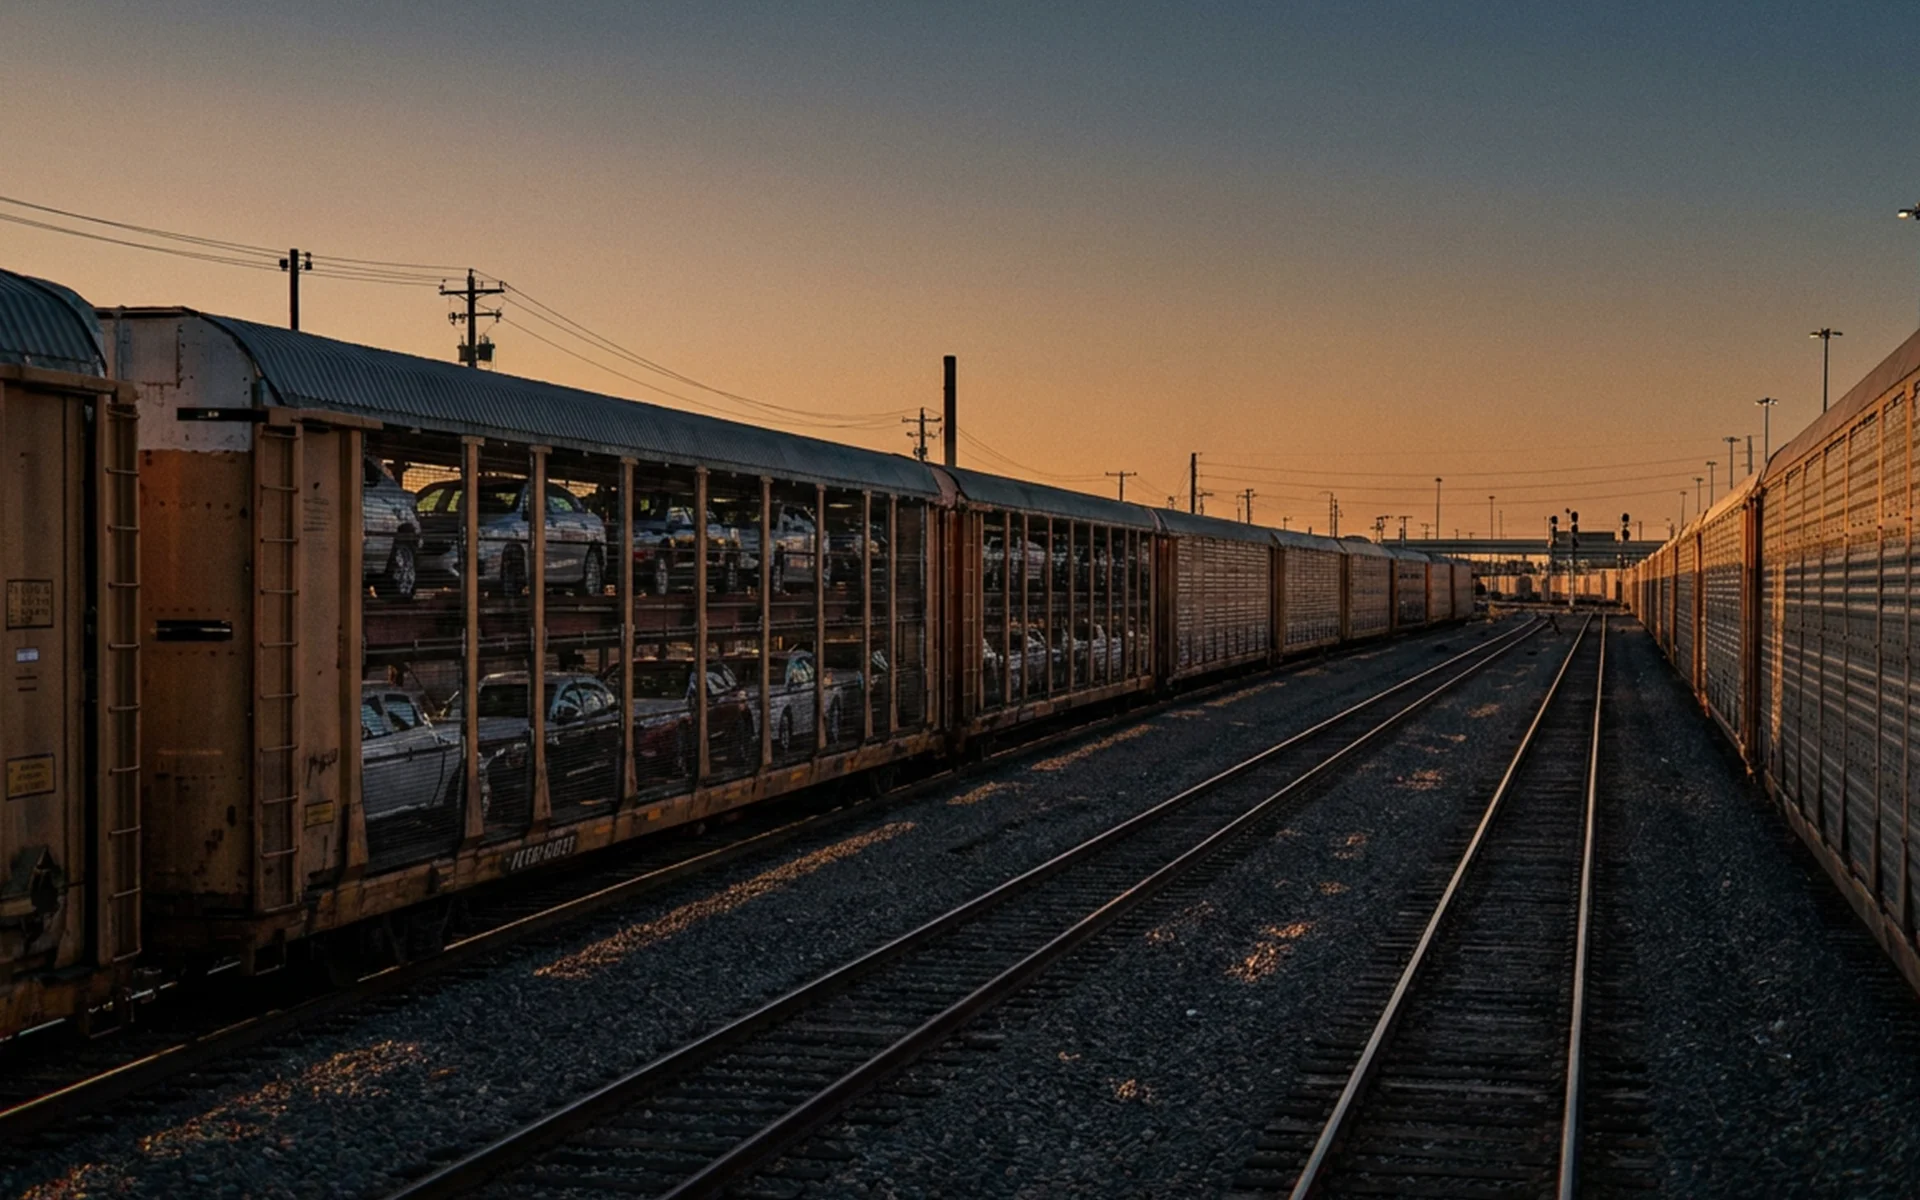
The architecture has four phases. Vehicles roll off the assembly line and stage at a plant compound. From there, units destined for distant regions move via rail line haul on enclosed bi-level or tri-level autoracks (specialized railcars built to carry 10 to 15 vehicles each). Trains arrive at mixing centers — rail-served vehicle distribution centers near major metro areas — where vehicles are sorted by destination. Over-the-road (OTR) car haulers then complete the final-mile drayage to individual dealer lots.
Rail can't reach a dealer lot. Class I railroads — the major freight networks: BNSF, Union Pacific, CSX, Norfolk Southern, CPKC, and CN — operate a terminal-to-terminal system. Their infrastructure stops where the highway network begins. A rubber-tired final mile is structurally non-negotiable.
A truck-only system is equally unworkable at scale. Replacing the 1.8 million annual rail carloads of motor vehicles and parts with highway capacity would require a driver pool the labor market can't supply, infrastructure the Interstate system can't absorb, and per-vehicle costs no automaker would accept. The dual-mode network isn't a redundancy. It's the only architecture that fits the geography.
The rail-vs-truck decision usually starts with a single comparison: cost per ton-mile.
On that variable, rail dominates. Class I rail freight typically averages between $0.03 and $0.05 per ton-mile. Over-the-road trucking sits at roughly $0.15 to $0.20 per ton-mile. Wolfe Research analysis indicates rail is broadly 12% to 14% cheaper than comparable truck movements, and rail is three to four times more fuel-efficient — modern locomotives move a ton of freight nearly 500 miles on a single gallon of diesel.
The capacity ratio reinforces the cost picture. A single autorack carries the equivalent of roughly four highway truckloads. A unit train can pull dozens of autoracks, moving hundreds of vehicles in a single dispatch. From a wholesale line-haul perspective, no truck network can match those economics.
Trucking carries a different cost structure. The American Transportation Research Institute reported that the average commercial operational cost of trucking reached $2.26 per mile in 2024, with non-fuel marginal cost at $1.779 per mile — driven by rising driver compensation, equipment payments, and insurance. Specialized car-hauler equipment, with its hydraulic stinger-steer configuration and tie-down systems, runs higher than standard dry-van capital cost. We invest in modern car carriers because the equipment directly affects safety, reliability, and condition on delivery — but that capital choice doesn't change the underlying per-mile math.
Where the two cost structures meet is the break-even distance. Rail's variable savings have to amortize the fixed handling costs of every multimodal move: origin drayage, terminal lift fees, switching, destination drayage. The generally accepted break-even threshold sits at roughly 500 miles. Below that, terminal handling and added transit time outweigh the line-haul savings. Above it, rail starts to pay back.
The 500-mile rule is elastic. Lanes with consistent bidirectional volume can break even sooner because trains build faster. Lanes with congested destination ramps or expensive metro drayage push the break-even out to 750 or 900 miles.
This is the math most in-house logistics teams already use. It is also the math that does not capture what determines the final cost of the shipment.
The cost-per-ton-mile comparison treats a vehicle shipment as a freight unit. In B2B finished vehicle logistics, the shipment is depreciating inventory tied to a deadline.
Most B2B buyers optimize on the rail savings. Lately we have seen clients default to rail for long-haul moves on the strength of the 12-14% cost advantage, then absorb the consequences on the back end: missed dealer windows, vehicles arriving in damaged condition after the modal handoff, and inventory aging in the pipeline while a sold unit sits in a terminal awaiting a sort. For dealership inventory transport, the savings on the freight invoice often gets consumed before the shipment reaches the lot.
The variables that actually drive the total cost don't appear on a per-ton-mile chart. Transit time variance affects every downstream commitment. Dwell at origin and at the destination ramp adds days that compound into floor plan financing cost — the daily interest a dealer pays on each unit of inventory it has not yet sold. Damage liability gets allocated at the modal handoff, not at the final stop, and the conditions of that handoff structurally favor disputes. Inventory carrying cost runs every day a vehicle sits in transit rather than on a sales floor.
A direct OTR run from the Midwest to South Florida covers the lane in 4 days under our standard, with a 3-hour pickup window target. The same shipment routed via rail and final-mile drayage can take 7 to 10 days door-to-door, depending on terminal fluidity. For a high-velocity dealership pulling inventory before month-end, or a rental fleet ramping up before peak season, those extra days are not abstract. They are sales-day delays and rental-day revenue gone.
This is where the modal decision should actually be made. The question is not "is rail cheaper per mile" — it almost always is, on long-haul. The question is whether the per-mile savings on a specific lane exceed the carrying cost, deadline risk, and damage-allocation friction that the multimodal route introduces.
For transcontinental volume on planned, repeatable lanes, rail wins that calculation easily. The shipments are scheduled far enough out that dwell variance gets absorbed by the production calendar, and the volume justifies the fixed handling cost.
For dealership inventory tied to a sales deadline, fleet repositioning before a peak window, or any scenario where a vehicle's value clock is ticking, the per-mile savings often look smaller than they did on the contract. The lane was the right unit of analysis. Per-ton-mile was not.
Dwell is the volatile variable hidden inside the rail cost advantage. It is the time a vehicle or railcar sits stationary at a node in the network — at the plant, at a classification yard, at a destination ramp.
The Surface Transportation Board (STB), the federal regulator that tracks rail performance metrics, reported an average rail terminal dwell of 21.7 hours across all Class I railroads in 2023. That figure conceals real volatility. During the 2022 network congestion, peak dwell at major carriers including Norfolk Southern, Union Pacific, and CSX ranged from 31 to 37 hours.
Origin dwell — the time between a vehicle rolling off the assembly line and physically leaving the plant — is harder to track publicly because it sits inside OEM (Original Equipment Manufacturer — the vehicle maker) operations. Benchmarking work by Ducker Carlisle has documented cases where a luxury OEM's origin dwell ran twice the industry average. Across a network moving millions of vehicles annually, hours of dwell translate into hundreds of millions of dollars of working capital trapped in the pipeline.
Automotive trains are harder to assemble than commodity unit trains. Coal or grain trains move uniform railcars carrying interchangeable freight. Finished vehicle trains require model-specific autorack matching to fluctuating factory output. That matching is operationally precise and slow, which is why automotive origin dwell tends to run longer than bulk commodity dwell.
For B2B clients with deadline-driven shipments, dwell is the single largest source of variance between the cost a rail move was supposed to deliver and the cost it actually did. Rental fleet ramp-ups before a peak rental window, dealer allocation pulls in the final week of a sales month, and auction-bound vehicles waiting on title clearance are all schedules where a 30-hour dwell spike at one terminal can cascade into a missed commitment downstream.
Final-mile OTR doesn't eliminate timing variance, but it removes the multi-node compounding. On our regular long-haul corridors, real-time shipment tracking gives clients location and ETA visibility from pickup through delivery. Variance lives within a single mode, not across handoffs.
Industry damage rates look reassuring on paper. Trucking damage in finished vehicle logistics typically runs 0.5% to 2%, with top asset-based carriers achieving above 99% damage-free delivery. Rail damage runs 1% to 2% in the modern enclosed-autorack era, down sharply from the open-rail period when vandalism, theft, and environmental exposure pushed historical rates above 4%.
Both modes are governed by the AIAG M-22 standard — the Automotive Industry Action Group's framework for finished vehicle damage handling. M-22 requires VIN-level inspection at every handover, and it establishes liability allocation at "first point of rest." That last phrase is where the operational reality and the published damage rates diverge.
Here is what the modal handoff actually looks like. Vehicles released from autoracks at a destination ramp are typically dirty. They are often wet, depending on weather between origin and destination. Inspection at the rail ramp is frequently performed at night, under poor lighting, on a paved lot with vehicles staged in tight rows.
Hidden damage is common. Chock failures inside autoracks during humping (the controlled coupling of railcars in classification yards, which transmits longitudinal shock through the train) can shift vehicles enough to cause door dings, suspension stress, or bumper scrapes that aren't visible until daylight. Undercarriage damage from steep loading or unloading angles rarely surfaces during a flashlight inspection.
This is where the per-ton-mile math fails its sharpest test. It treats rail damage as a flat 1-2% statistical risk. The practical reality is that liability isn't determined by the damage rate. It's determined by what gets documented at the handoff — and the handoff happens under conditions that make visual inspection alone unreliable.
For B2B clients, the financial consequence isn't the damage rate. It's where in the chain of custody the damage gets attached. A scratch discovered at the dealer lot, with no documented evidence of its condition at rail unloading, becomes an allocation dispute between the OEM, the rail carrier, the destination drayage carrier, and the final-mile carrier. Resolving that dispute consumes time and absorbs cost — even when the damage itself is minor.
Our transportation management system (TMS) generates timestamped photo documentation and damage reports at both pickup and delivery, shared with all parties in real time. At a rail ramp, that documentation establishes the vehicle's condition at first point of rest under conditions where the human eye, in poor light, after a long route, isn't reliable evidence. It protects us. It also protects the OEM, the dealer, and any other party in the custody chain. Above 99% damage-free delivery is the outcome of that protocol — not the protocol itself.
The takeaway for buyers evaluating rail vs. truck: damage rates are similar across modes, but the handoff between modes is where allocation gets contested. Final-mile OTR with rigorous documentation closes that exposure. A multimodal move without it leaves it open.
Electric vehicles (EVs) are reshaping the truck side of the modal split — not because of demand patterns, but because of physics.
U.S. Federal Bridge Formula rules cap a commercial semitrailer at 80,000 lb gross vehicle weight rating (GVWR — the maximum legal loaded weight on the highway). Battery electric vehicles routinely weigh 30% more than their internal combustion equivalents. A Ford F-150 Lightning carries roughly 1,600 lb more than the gas F-150. A Rivian R1T or GMC Hummer EV exceeds 7,000 to 9,000 lb per unit.
The result on the highway side: car haulers weigh out before they cube out. The trailer has empty slots. The truck is at federal weight limit.
In our operation, our standard 9-car haulers drop to 7 or 8 vehicles when loaded with typical EVs. With Tesla Cybertrucks, that capacity falls to 5 or 6 vehicles. This is not a temporary anomaly tied to specific models. It is a structural change in highway slot economics that scales with EV mix.
Rail is largely insulated from this constraint. A modern freight railcar carries a 286,000 lb gross rail load. A fully loaded tri-level autorack with 15 heavy EVs at roughly 4,500 lb each totals 67,500 lb — well within structural capacity. As EV production scales, rail's per-unit economics on long-haul stay stable while highway per-unit economics functionally compress.
The effect on B2B buyers operates in both directions. Rail's structural advantage on transcontinental line haul deepens. Highway capacity on the final mile gets more expensive, even on lanes where rail isn't a substitute, because the same trailer now hauls fewer vehicles per dispatch.
Operationally, EV transport carries documentation requirements that don't apply to internal combustion shipments. We schedule EV loads at a 40% state-of-charge working standard (with winter qualifiers), and our drivers complete EV-specific photo documentation at pickup and delivery — including charge port condition and dash battery reading. Pre-hire training and fleet manager escalation support are part of how we run those loads. The protocols aren't optional; they are the only way to manage liability on a high-value, weight-constrained, charge-state-sensitive vehicle.
The OTR car-hauler market entered 2025 with one of its largest legacy carriers gone.
Jack Cooper Transport, a unionized hauler with roughly 1,300 tractors and an estimated 13% national market share, ceased operations in early 2025 after Ford invoked a 30-day exit clause on a 40-year contract in January, and General Motors followed with a system-wide stop-order weeks later. The closure removed a significant block of capacity from the final-mile market overnight.
The immediate effect was upward pressure on spot-market rates and a reallocation of OEM volume to remaining asset-based carriers. The longer-term effect is a structural shift toward newer, non-union fleets. Industry consolidation through entities like Proficient Auto Logistics — which brought several smaller carriers under a single public structure with a younger average fleet age — has accelerated.
For B2B buyers, the implication is straightforward. Final-mile capacity on regular lanes is tighter than it was a year ago, and spot pricing is more volatile. Stable contracted relationships with asset-based carriers — operators who own their equipment and control their dispatch — are worth more in this market than they were when capacity was loose. Reliability, not unit price, becomes the binding constraint.
The 500-mile break-even rule is a useful starting point. It is not a complete answer for every B2B shipment.
Direct OTR makes sense at long distances when velocity is the binding constraint, not per-mile cost. Several B2B scenarios fit that profile.
Dealership inventory transport tied to a month-end allocation pull — where a missed window pushes a sale into the next reporting period — values transit certainty above per-mile savings. A direct truck dispatched on a defined pickup window beats a multimodal move with rail dwell variance, even when the freight rate is higher.
Rental fleet repositioning before a peak rental window operates on the same logic. Every day a vehicle sits in transit is a rental day not earned. A 4-day OTR run preserves more revenue than a 9-day multimodal route with $100 of freight savings.
Vehicles moving to or from auction depend on title clearance before dispatch can begin. Our standard protocol on auction work is no dispatch before title clearance, which keeps the chain of custody clean — but once the title clears, the schedule is compressed. Rail dwell that would be absorbed in a standard production-to-dealer move becomes acute when the entire shipment runs against an auction-house deadline.
Repeatable B2B lanes with predictable volume favor a different variable: consistency. Dedicated account management — a named point of contact rather than a rotating dispatch queue — works because the carrier knows the lane, the customer's protocol, and the deadlines that recur every month. Rail's batched scheduling doesn't deliver that relationship.
The honest framing for any modal decision is this: rail is structurally necessary for transcontinental finished vehicle volume at the macro level. The practical question for any individual lane is whether the per-mile savings outweigh the deadline risk, dwell variance, and handoff friction the route introduces. For a meaningful share of B2B shipments, they don't.
GB Cargo is an asset-based auto transport carrier headquartered in West Lafayette, Indiana, operating a fleet of 40+ modern car carriers serving OEMs, rental fleets, dealerships, auctions, and fleet operators nationally. We deliver above 99% damage-free, with TMS-generated timestamped photos and damage reports at pickup and delivery shared with all parties. Our Illinois–South Florida corridor runs to a 4-day standard with a 3-hour pickup window target. EV loads run on a 40% state-of-charge working standard with EV-specific documentation. Every B2B client works with a dedicated account manager — not a call center.
At what distance does rail typically beat truck for finished vehicle transport?
The generally accepted break-even sits around 500 miles. That figure is elastic — lanes with consistent volume can break even sooner because trains build faster, while lanes with congested destination ramps or expensive metro drayage can push the threshold to 750 or 900 miles. The 500-mile rule is a useful starting point, but the right modal call also accounts for dwell variance, deadline sensitivity, and damage allocation, not just per-ton-mile cost.
Who's liable when damage is discovered after a vehicle moves on both rail and truck?
Under the AIAG M-22 standard, liability is allocated at "first point of rest" — meaning the condition of the vehicle at each handover determines who bears responsibility for any damage discovered downstream. In practice, that allocation depends on what gets documented at the handoff. Rail-ramp inspections at night, in poor light, with dirty or wet vehicles often fail to surface hidden damage. Timestamped photo documentation at pickup, with reports shared across the chain of custody, is what closes that exposure for both carriers and OEMs.
Why has highway car-hauler capacity tightened in 2025?
The early-2025 closure of Jack Cooper Transport removed roughly 13% of national OTR car-hauler capacity. Spot rates rose, and OEMs reallocated volume to remaining asset-based carriers. EV weight constraints have compounded the pressure — heavier vehicles reduce per-trailer slot count, so even carriers operating the same fleet now haul fewer units per dispatch. The combined effect is tighter final-mile capacity industry-wide.
The 75/60 split between rail's volume share and trucking's revenue share isn't a market quirk. It's the clearest signal that rail vs. truck is not a per-ton-mile decision. Rail wins the long-haul wholesale economics that move continents of inventory efficiently. Trucking owns the friction-loaded final mile where deadlines, damage allocation, dwell variance, and inventory carrying cost actually get resolved.
The right modal mix for any B2B operation isn't national. It is lane-by-lane. Transcontinental, schedule-tolerant volume belongs on rail. Deadline-driven, velocity-sensitive shipments belong on the highway, even at distances where rail looks cheaper on paper. The buyers who optimize on per-ton-mile alone consistently absorb the unmodeled cost downstream. The buyers who optimize on the lane — matching each shipment to the cost variable that actually drives its outcome — consistently don't.
The most useful exercise before your next contract cycle isn't a fleet-wide review. It's a single-lane audit. Pick one regular long-haul corridor where you currently run multimodal, and rebuild the cost picture against four variables instead of one: line-haul rate, dwell exposure, handoff documentation, and final-mile transit certainty. The result will tell you whether the lane is genuinely a rail lane or whether it has been one by default.
If you want a perspective on a specific lane from the final-mile side, our team can review it with you. Reach us through the contact page.

Stay informed on the latest news and insights from GB Cargo.