What the Proficient–Hansen & Adkins Deal Means for OEM Carrier Strategy
Proficient's Hansen & Adkins deal pushes one platform to 25% of North American vehicle delivery. What OEM logistics planners should actually do about it.
Qualification takes longer than disruption does.
By the time a service problem shows up on your carrier scorecard, the alternative carrier that could absorb that volume is often months away from accepting its first load. Insurance verification, safety review, systems integration, and test loads do not compress because someone upstairs is unhappy. They run at the speed of the queue they sit in.
Here is the number that reframes the entire conversation about auto transport carrier consolidation: in some of our own cases, qualification with a large shipper has taken more than a year from first contact to first dispatched load. Nothing went wrong in those cases. That was the process working normally.
On August 10, 2026, Proficient Auto Logistics (NASDAQ: PAL) signed a definitive agreement to acquire Hansen & Adkins Auto Transport. Most coverage will focus on what the combined company can do. We think OEM (Original Equipment Manufacturer — the vehicle maker) logistics planners should be looking at something else entirely: the calendar.
The upfront purchase price is $130 million, structured as approximately $75 million of assumed equipment debt, roughly $52 million in cash, and about $3 million in PAL common stock. Up to $22.1 million in additional earnout depends on near-term EBITDA (Earnings Before Interest, Taxes, Depreciation and Amortization — a common proxy for operating cash generation) targets.
PAL reports the deal adds approximately 725 company-owned tractor-trailer units, more than doubling its owned fleet, along with more than 900 personnel. The combined platform is expected to move more than four million vehicles annually — roughly 25% of new-vehicle delivery volume in North America.
There is one number in this deal that does not reconcile, and it matters more than it looks.
PAL describes 725 company-owned tractor-trailer units. A carrier registry entry derived from FMCSA (Federal Motor Carrier Safety Administration — the federal body that regulates commercial trucking) data lists Hansen & Adkins at 965 power units and 816 drivers, operating in 32 states through more than 40 terminals.
Those figures sit 240 units apart, and no public source reconciles them. Averaging them would be worse than useless.
The gap most likely reflects some combination of leased-on owner-operators counted in the registry but not acquired as company assets, older or non-revenue equipment still registered under the carrier's authority, and different reporting dates.
For planning purposes, the distinction is not academic. Capacity a carrier owns and dispatches directly behaves differently under stress than capacity contracted from owner-operators, because the second layer can leave. If you are modeling how much hard capacity actually transfers into the combined platform, 725 and 965 produce meaningfully different answers, and right now nobody outside the two companies can tell you which one to use.
The 2026 operating-ratio deterioration has nothing to do with Hansen & Adkins. The deal had not closed during any reported quarter, so those numbers describe PAL's pre-existing platform operating under 2026 market conditions.
PAL's adjusted operating ratio — operating expenses as a percentage of revenue, where anything above 100% means losing money on operations — moved from 96.3% in Q3 2025 to 103.4% in Q1 2026, then to 99.5% in Q2 2026. PAL attributes the weakness to reduced available capacity following market exits and to cost inflation outpacing pricing recovery, alongside a year-over-year decline in industry new-vehicle sales.
There is a second measurement problem worth flagging, because the two get mixed together in secondary coverage.
The full-year GAAP operating ratio disclosed in PAL's 10-K was 108.2% for 2025, compared with 103.3% for 2024. The quarterly adjusted operating ratio management discusses on earnings calls sits in the 96–99% range. These are different measurements taken on a different basis, and comparing one to the other produces a far worse story than the evidence actually supports.
What the full record supports is that the trend is not moving cleanly in either direction. Adjusted operating ratio improved sequentially through 2025 — 98.7%, then 96.7%, then 96.3% — before reversing in 2026. Full-year GAAP operating ratio worsened across both years. Neither "the integration is working" nor "the integration is failing" survives contact with the complete data set, and any vendor pitching you either version is selecting evidence.
The standard narrative about a deal like this writes itself: bigger platform, degraded service, freight spilling to regional carriers. We are a regional carrier. We do not think that is what happens, and the best available evidence is against it.
When Ford and GM terminated Jack Cooper in January and February 2025, the volume moved quickly — GM began using other trucking companies within days. But it moved to other large asset-based national carriers, not to small regional ones. Precision Vehicle Holdings picked up Ford-specific work rapidly.
PAL's own executives said publicly at the time that Jack Cooper's exit would not produce a sudden influx of business for rivals, and that gains would spread across several quarters through an orderly bid process rather than a scramble. That was a carrier arguing against its own commercial interest in the moment, which makes it more credible rather than less. It also happens to argue against ours here.
There is a narrower version of the argument that the same evidence confirms, and it is considerably more useful.
Discussing the same episode, PAL's chief executive and chief operating officer said OEMs would, for continuity's sake,
That is the largest player in finished-vehicle transport confirming that OEM planners maintain standing relationships with qualified alternate carriers, and that those relationships are what get activated when something breaks. Not an RFP. Not a scramble. A list.
So the opening created by consolidation is not one that any capable carrier can walk through when trouble starts. It is a list you are either on or you are not — and the list gets built during calm periods, which is exactly when nobody feels urgency about building it.
It is worth being precise about what this does and does not claim. Qualified alternate carriers do not become more valuable because PAL's market share rose to 25%. They were always valuable for the same reason, and OEM planners who already maintain regional backup relationships were not doing something clever — they were doing something standard. What changes with a deal this size is the consequence of having skipped it, because a larger share of volume now sits behind one set of operating decisions.
The first symptom of a carrier integration is rarely a missed delivery. It is a phone call that reaches the wrong person.
PAL's own history documents the financial version of the pattern. The company was formed in May 2024 as a simultaneous combination of five independent carriers — Delta Auto Transport, Deluxe Auto Carriers, Sierra Mountain Group, Proficient Auto Transport, and Tribeca Automotive — funded by a $215 million IPO. Adjusted operating ratio ran around 91.7% to 91.8% through mid-2024, degraded to 98.8% and 98.3% in the third and fourth quarters of 2024 as combination costs stepped up, then partially recovered through 2025.
Two to three quarters of strain, followed by partial rather than full recovery over 12 to 18 months. That is a documented template, though not a guarantee.
The mechanism differs this time in a way worth noting. The 2024 combination brought five similarly sized companies together simultaneously, with no pre-existing operating system to disrupt. This one folds a single founder-operated business with roughly $400 million in annual revenue into a national platform that is already running. Bolting onto live operations is a structurally harder problem than building from parts.
One variable that would tell you a great deal is simply unavailable. No public data exists on driver attrition during any of PAL's prior acquisitions — its filings and earnings commentary do not disclose turnover metrics tied to the five founding companies or to the acquisitions that followed. Driver retention is the input that most directly determines whether pickup windows hold during an integration, and there is no track record to forecast from. Hansen & Adkins figures are equally unavailable; the company was privately held and filed no public disclosures.
In our experience, the earliest visible symptom of a carrier organizational change is not damage and not delay. It is ambiguity about who can authorize a routing change.
During a merge, dispatch authority gets redistributed. Terminals get reassigned. The person who could approve a delivery-address change last month now sits in a different reporting structure, and the person who can approve it this month has not been introduced to your team yet. Loads still move. But the exception-handling path — the one you only use when something has already gone sideways — is the part that quietly stops working first.
We hold routing change authority with dispatchers only, for exactly this reason. One defined role owns it, and our dispatchers verify destination addresses visually against mapping tools before any change goes through. It is a small control. It is also precisely the kind of control that gets fuzzy when two dispatch organizations become one, which is why a named account contact rather than a rotating queue matters more during an integration window than at any other time.
PAL's top-five customers accounted for 59% of revenue in 2025, up from 49.6% in 2024. The top ten reached 73.8%, up from 70.9%. Concentration increased as the platform scaled — it did not diversify away.
Meanwhile the combined entity is expected to reach roughly 25% of North American new-vehicle delivery volume.
The cause-and-effect here is mechanical. When a single carrier holds a larger share of your national volume, and that carrier's own revenue depends more heavily on fewer customers, any single dispatch disruption, systems migration, or driver-retention problem touches a larger portion of your network at once. Neither party has done anything wrong. The arithmetic simply compounds in one direction.
There is a real limit to what anyone can assess right now, and it deserves stating plainly. No lane-level or terminal-level overlap map has been disclosed by either company. PAL described more than 55 locations before the deal; Hansen & Adkins is listed at more than 40 terminals.
Whether those networks overlap heavily or complement each other determines whether integration means consolidating redundant terminals — which produces closures, reassignments, and service disruption in specific markets — or stitching together complementary coverage, which is far less disruptive. Those are very different operational outcomes for your lanes, and the information is not public. Anyone who tells you they know which one it is right now is guessing.
In some cases, our qualification with a large shipper has taken more than a year from first contact to first dispatched load.
That figure surprises people who assume onboarding a carrier is a procurement formality. Here is what the process typically covers:
Each of those gates has an owner and a queue on the shipper's side. Urgency does not remove the insurance review or shorten the systems integration. It just makes everyone unhappy while they happen anyway.
Risk, legal, procurement, and logistics all touch the file, and each has its own backlog. A carrier qualification that begins during a service crisis is competing with that same crisis for the same people's attention — which is why qualifications started under pressure tend to run slower, not faster, than the ones started when nothing was wrong.
A signed contingency agreement with no volume history, no scorecard data, and no live systems connection is not a qualified carrier. It is a document.
The questions worth asking during qualification are narrower than most carrier questionnaires suggest. Who holds authority to change a route, and how is that authority verified? What is the documented condition-reporting standard at pickup and delivery, and who receives it? What is the realistic weekly throughput on the specific corridor you would use, as opposed to total fleet size? Fleet counts and coverage maps tell you very little about whether a carrier can absorb your volume on the lane where you would actually need them.
The evidence from the Jack Cooper episode points specifically at carriers already in the system — in the TMS (Transportation Management System — the software a shipper uses to plan, tender, and track freight), on the scorecard, with recent performance data attached to their name. Periodic real volume is what keeps that current. A relationship that has not moved a vehicle in eighteen months has expired insurance certificates, an untested integration, and nobody on either side who has spoken recently enough to pick up the phone with confidence.
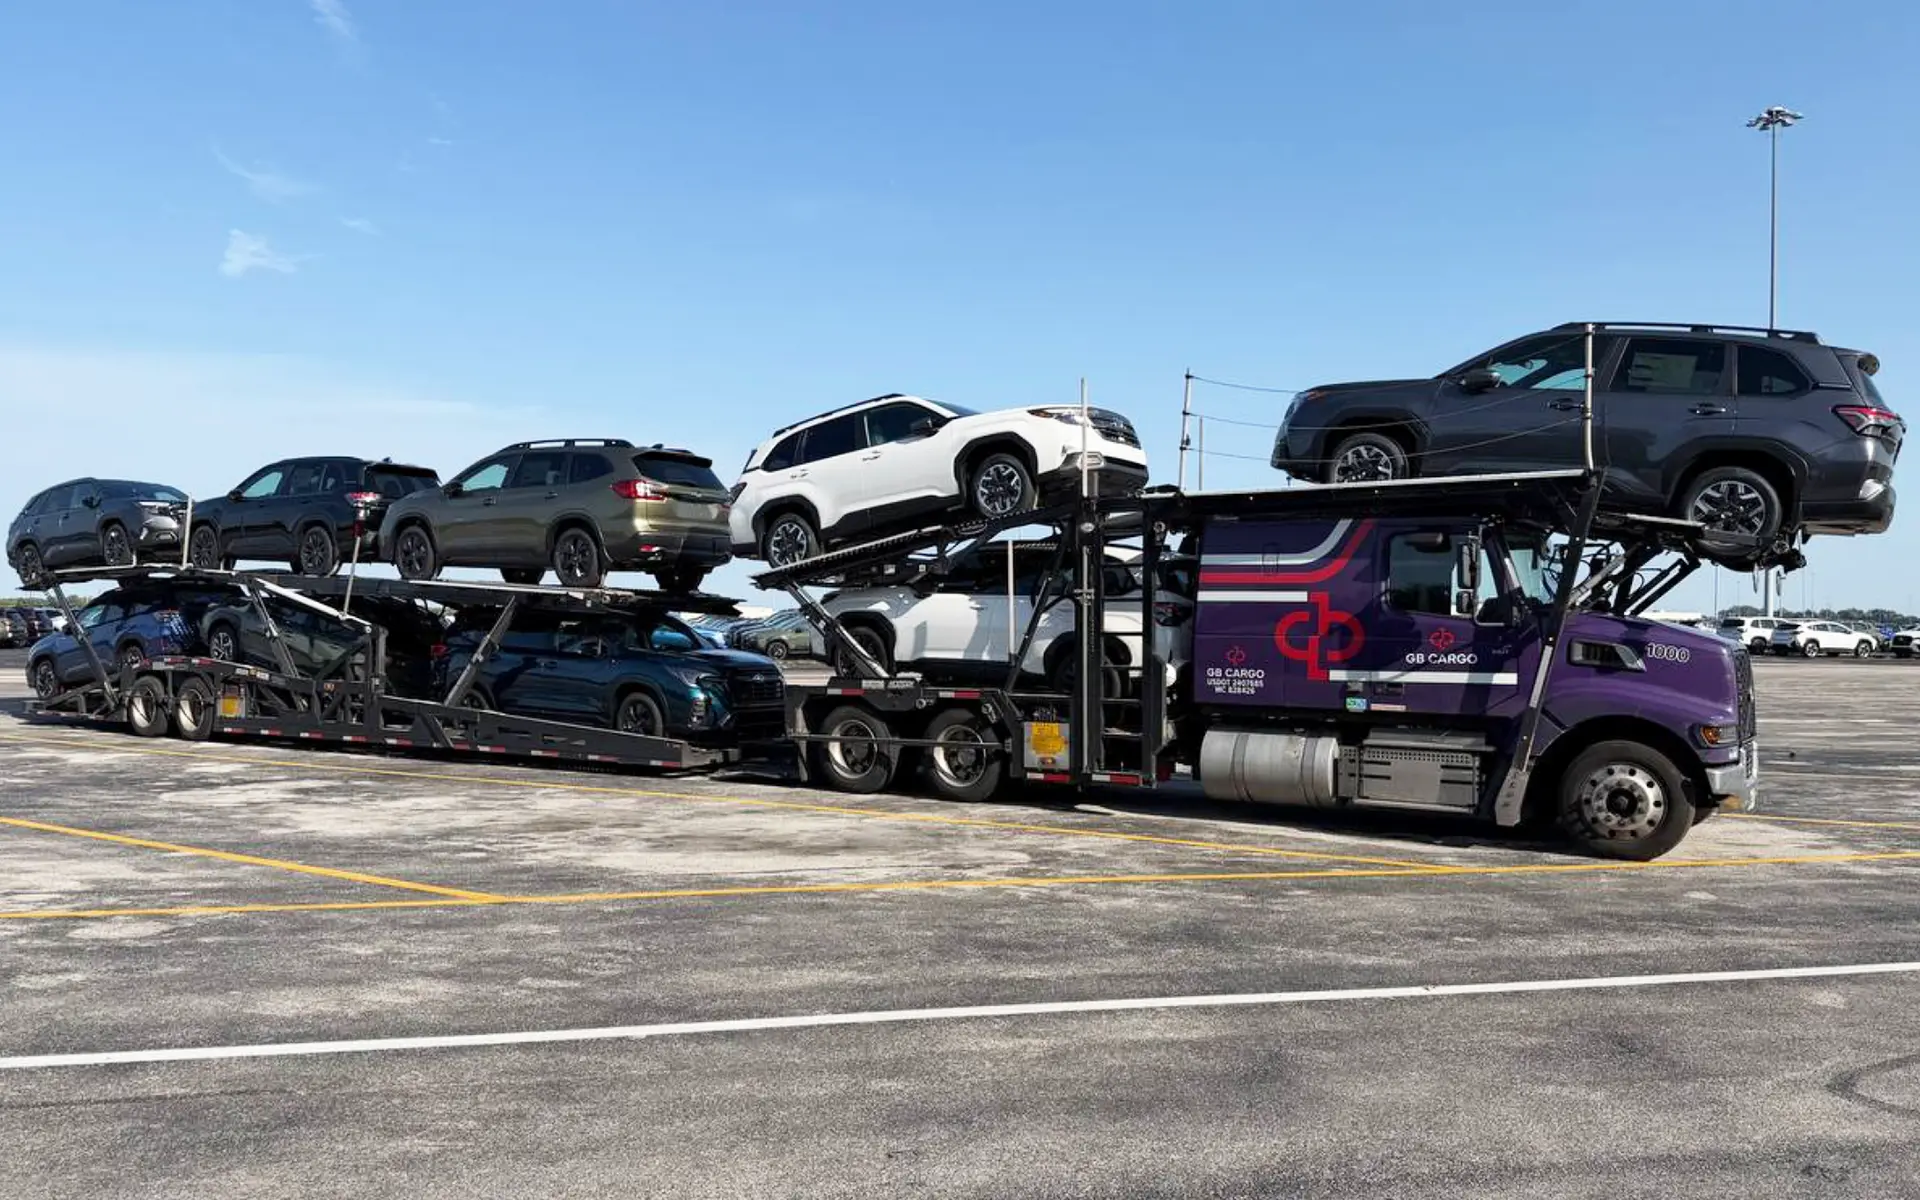
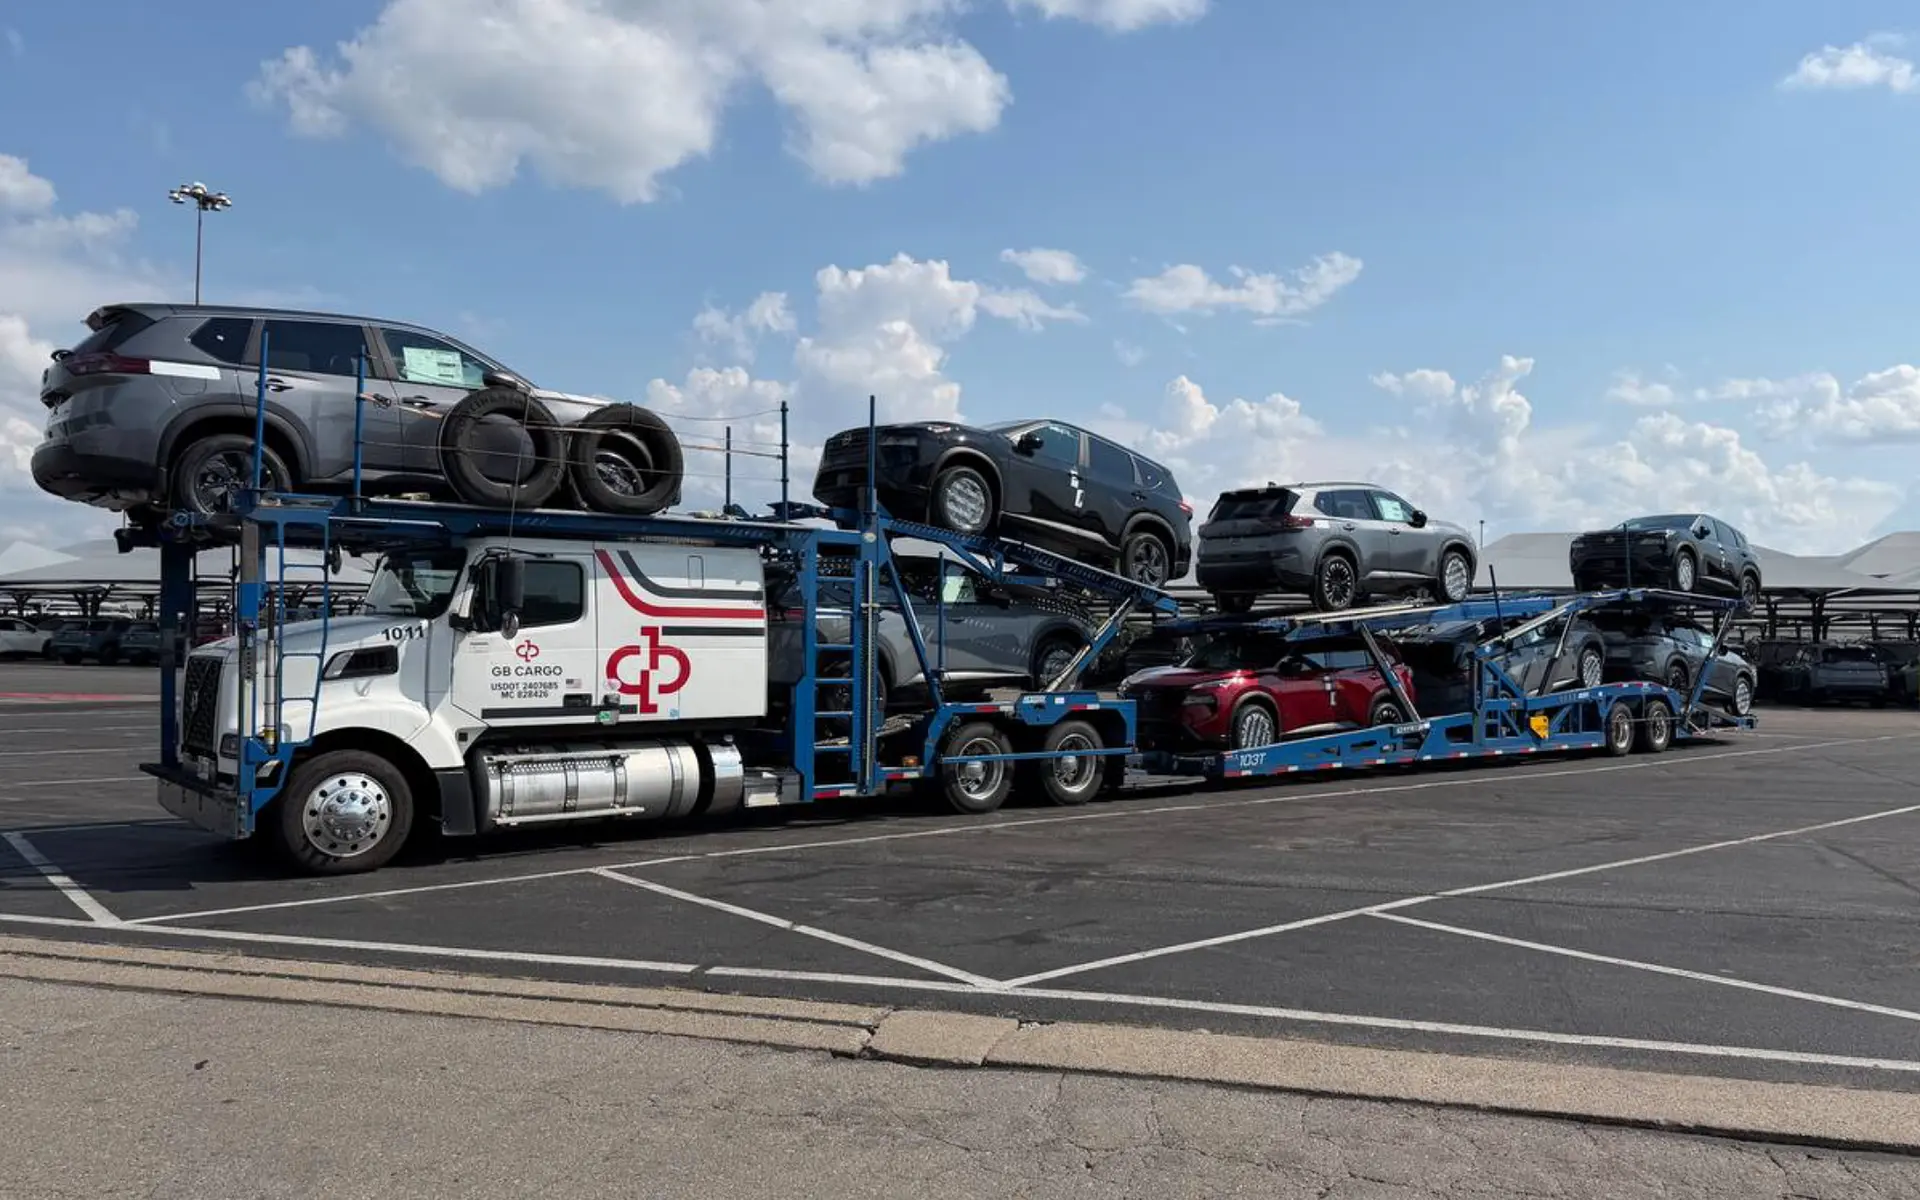
Our own scope is worth being precise about, because it determines how a relationship like ours would actually be used. We are an asset-based carrier — we own and operate our equipment and do not broker freight — running more than 40 trucks configured as 9-car haulers from our Chicago terminal. Our core corridors run Illinois to South Florida, Texas, California, and New York, with triangle routing between hubs. On those corridors we typically move 100 or more vehicles per week in one direction. That is depth on defined lanes, not national coverage, and how we work with OEM logistics teams reflects that distinction.
Our Illinois–South Florida transit benchmark is typically four days. We target a three-hour pickup window for a 9-car hauler loading at a single location. Our damage-free delivery rate runs above 99%, supported by timestamped photos at pickup and delivery shared with every party on the move — the same shipment status visibility that qualification reviews increasingly ask carriers to demonstrate before a first load, alongside coverage that meets OEM qualification thresholds.
For multi-region, multi-plant national contracts, the large platform is usually the correct choice.
Scale buys backhaul density that shortens empty miles and holds rates down. It buys national dispatch flexibility — the ability to shift equipment between regions when a plant changes its build schedule. It buys single-scorecard administration instead of managing eight carrier relationships across eight regions. And it buys the ability to absorb an entire program rather than a corridor.
A 40-truck fleet cannot match any of that. We do not claim to.
There is a further data point that cuts against our own position, and it belongs in this article. Hansen & Adkins was a large, stable, independent carrier in its own right — more than 40 terminals, 32 states, founder-operated, roughly $400 million in annual revenue. It chose to sell into the platform rather than remain independent. That is a genuine signal about the economics of staying independent at scale, and it is not a signal in our favor.
The resolution is not that one model beats the other. It is that they solve different problems inside the same network. National platforms carry the base load. Corridor carriers carry depth, contingency, and the specific lanes where a specialist's density beats a generalist's reach. An OEM network built on only one of the two is exposed in a way it has probably never quantified.
We are an asset-based finished-vehicle carrier headquartered in West Lafayette, Indiana, with a terminal in Chicago. We own and operate our equipment — we do not broker freight to third-party carriers we cannot vet or control.
Our fleet runs more than 40 trucks configured as 9-car haulers on defined corridors: Illinois to South Florida, Texas, California, and New York, using triangle routing between hubs. On our core corridors we typically move 100 or more vehicles per week in one direction.
Every client works with a dedicated account manager rather than a rotating dispatch queue. Shipment status is visible from pickup through delivery, and timestamped condition photos at both ends are shared with all parties on the move. Our damage-free delivery rate runs above 99%.
The information you need to assess this integration arrives on a published schedule. Four moments matter:
That last item deserves particular attention. At announcement, management guided to a 97% adjusted operating ratio and an 8–9% EBITDA margin for combined second-half 2026 results, while explicitly stating that the guidance does not include much synergy benefit because integration work is still being costed out. Synergies from network optimization, maintenance, procurement, backhaul opportunities, and general and administrative savings are expected to begin materializing in 2027.
No run-rate dollar figure has been published. That absence is itself informative — it indicates management is not yet willing to commit to a number, and it hands you a dated window running from now into 2027 in which closer scorecard scrutiny of the combined platform is warranted.
Does this deal mean I should move volume away from my primary carrier?
No — and the evidence does not support that reaction. PAL's platform performance in 2026 reflects market conditions and pre-existing operations, not Hansen & Adkins integration, because the deal had not closed. The defensible response is not reallocation. It is making sure you have at least one actively qualified alternate carrier per region before you would ever need to use one.
How long does it take to qualify a new finished-vehicle carrier?
Longer than most planning assumes. In our experience it has taken more than a year with some large shippers, from first contact through insurance verification, safety review, systems integration, scorecard onboarding, and test loads to a first dispatched load. Shorter timelines happen, but they depend on the shipper's internal queue rather than the carrier's readiness.
What is the difference between a backup carrier contract and an actively qualified carrier?
A contract establishes terms. Active qualification means the carrier is live in your systems, currently on your scorecard, carrying current insurance certificates, and has moved recent volume. When a primary carrier fails, the second category can accept loads within days. The first category starts the qualification process from something close to zero, at the worst possible moment.
Consolidation does not create an opening that alternative carriers can walk through when service degrades. The Jack Cooper episode showed the opposite: displaced volume moved fast, and it moved to carriers already qualified and already in the system. What a deal of this size actually changes is the cost of not having done that work in advance, because a larger share of your national volume now depends on a single platform's dispatch, systems, and driver retention holding steady through an integration whose network overlap has not been disclosed. The question is not whether alternative capacity exists. It is whether the capacity you would want has already cleared your own qualification process.
Pull your carrier list for one corridor — whichever one carries the most volume you cannot afford to have sit — and check three things for every non-primary carrier on it: current insurance certificates on file, a live systems connection, and volume moved within the last twelve months.
Whatever number clears all three is your real contingency depth on that lane. It is usually smaller than the number of contracts signed. If it comes up short on the Illinois-to-South Florida, Texas, California, or New York corridors, starting a qualification conversation now costs you a few hours during a calm period instead of several months during a difficult one. The equipment we own and maintain ourselves is the part we can show you quickly; the qualification file is the part that takes time.
Stay informed on the latest news and insights from GB Cargo.