Will Record Diesel Prices Cause a Car-Hauling Capacity Crunch?
Diesel hit a record $6.53/gal. Here's what it adds per car-haul mile, which lanes tighten first, and why the real squeeze is lane by lane, not national.
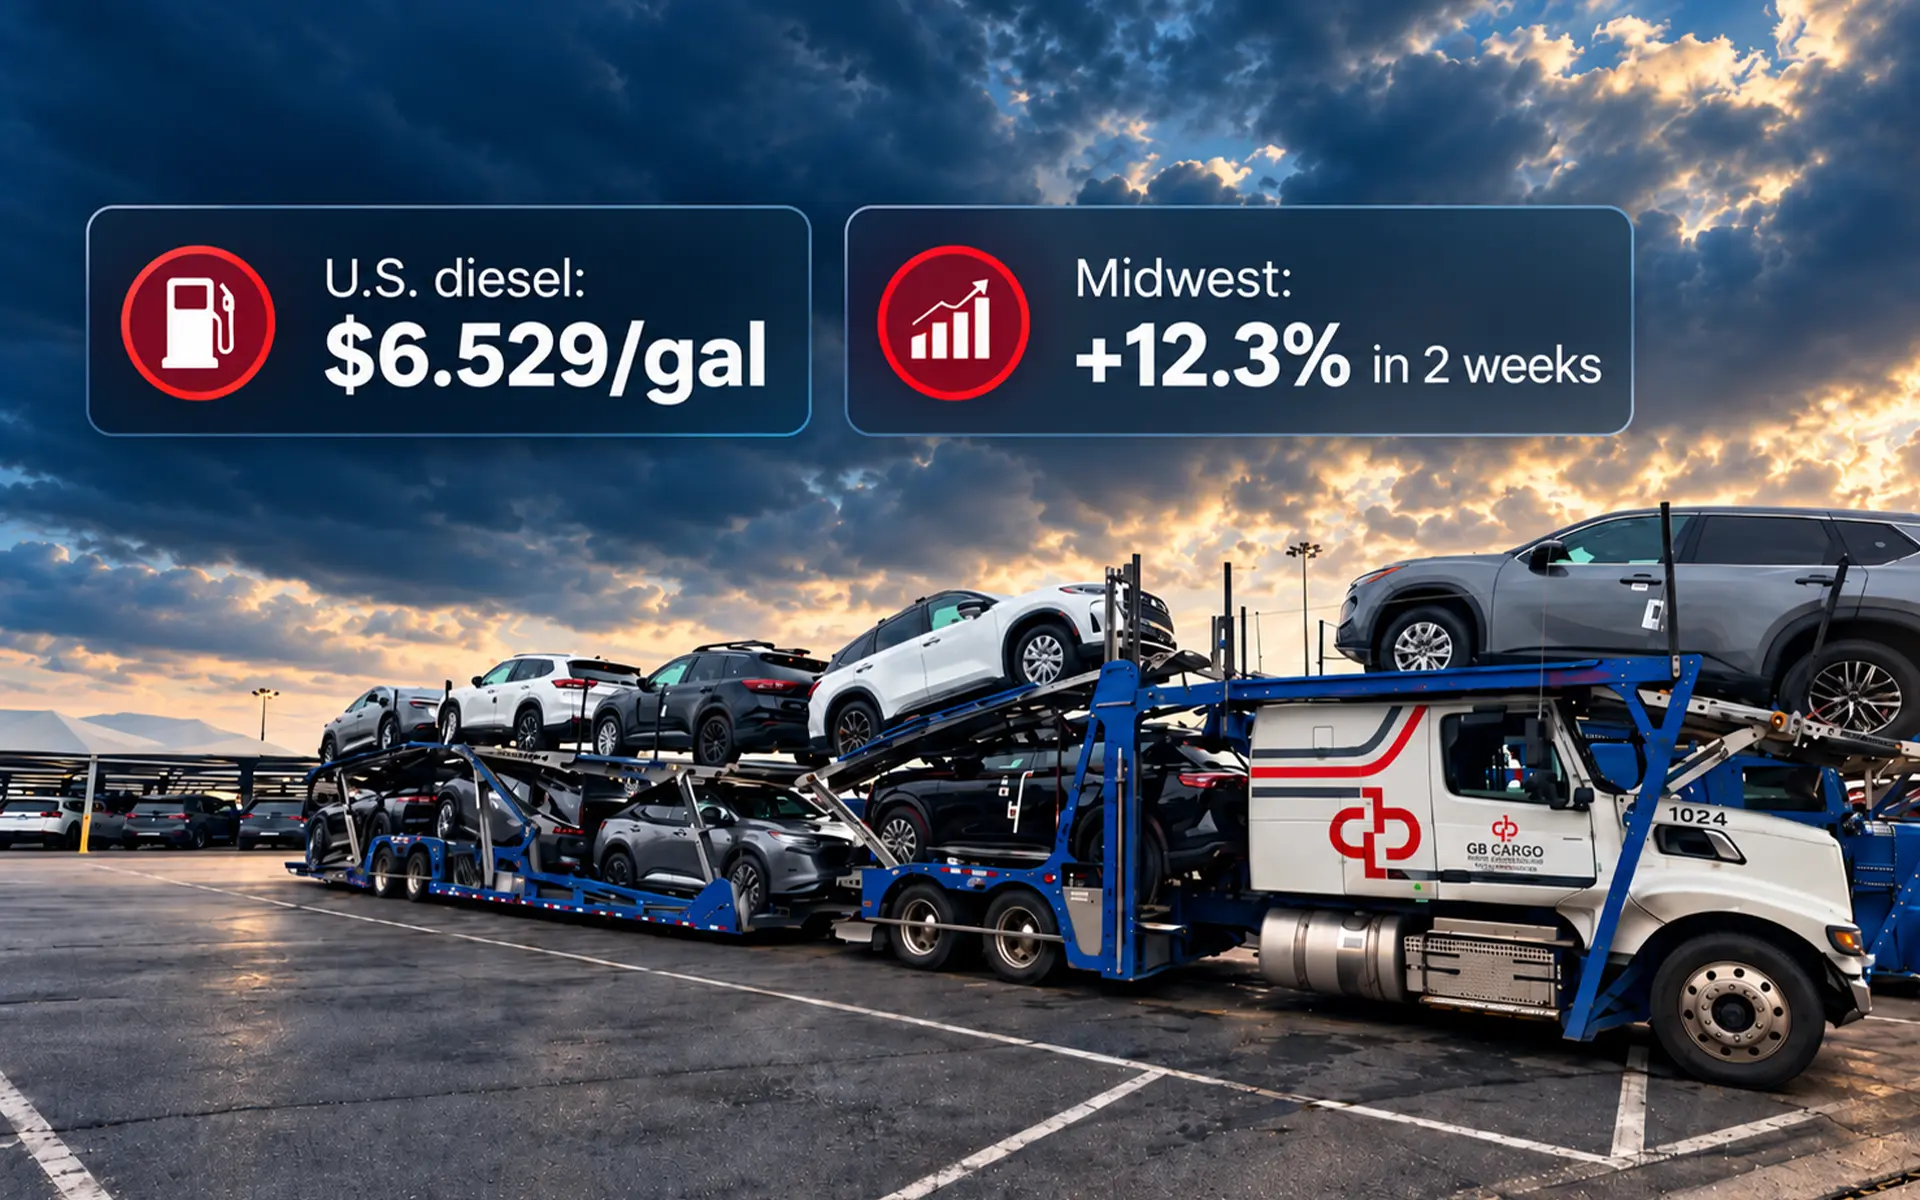
Diesel set a new record for the second week in a row. Quotes are up, some loads are sitting longer than usual, and headlines are predicting a truck shortage. The market is pointing somewhere else: the squeeze is landing on specific lanes, not the whole map.
Across the general market, we've seen the prices brokers are willing to pay carriers climb roughly 10–20% in recent weeks. The size of that increase depends heavily on the route. That spread tells you more than any national average. It means carriers are pricing lane by lane, and shippers who know which of their lanes are exposed will spend less and wait less than those reacting to the headline number.
The U.S. average retail diesel price climbed from $5.967 per gallon on September 7 to $6.529 on September 21. That's a 56-cent jump, or 9.4%, in two weekly readings, according to the EIA (U.S. Energy Information Administration — the federal agency whose weekly diesel price most fuel surcharges are tied to). Compared with a year ago, diesel is up $2.78 per gallon, or 74%.
The September 14 reading of $6.285 had already broken the 2022 record of $5.810. A week later, the national average and every region set new highs again.
For car hauling, the regional split matters more than the national number. The Midwest saw the steepest percentage rise, and it's where many finished-vehicle lanes begin, at assembly plants and railheads. It's also our home region. The West Coast rose the least in percentage terms but still has the country's highest prices, while the Gulf Coast remains the cheapest place to fill a tank.
The year-over-year picture is starker. Midwest diesel is up $2.95 per gallon, or 79%, from the same week in 2025. Any rate agreement priced on last fall's fuel assumptions is now working from a very different cost base.
Diesel is tight on its own terms, which is why it can stay high even if crude oil settles down. In its September outlook, the EIA pointed to constrained Middle East oil flows, falling global inventories, lower distillate production worldwide, strong U.S. exports, and Russian refinery outages expected to last into 2027. It also expected the diesel crack spread (the gap between the price of crude and the diesel refined from it) to stay above $2 per gallon through November.
The physical supply data backs that up. For the week ended September 18, U.S. distillate stocks sat at 107.4 million barrels, 12% below the five-year average, and East Coast stocks were about 31% below normal. Refinery utilization dropped from 96.8% to 94.0% as fall maintenance season began, just as harvest demand and heating demand start to compete for the same barrels.
Even the official forecast is running behind. The EIA raised its 2026 average diesel forecast to $5.07 per gallon from $4.85, but its model inputs were locked on September 3, before most of this spike. Treat that number as a sign of direction, not a prediction of what you'll pay at the pump next month.
There is a counterweight. NYMEX ULSD futures (ultra-low sulfur diesel — the benchmark contract traders use to price diesel) set a record on September 14 and then traded lower, with later months priced below nearer ones. That points to a plateau more than a straight climb. But pump prices lag wholesale prices, and contract surcharges lag the pump, so relief would take weeks to reach invoices.
The two-week increase adds about 10 cents to every mile a loaded car hauler drives. To show the math, we'll use a common industry example rather than our own fleet data: a 9-car stinger (a car-hauler setup where the trailer connects behind the tractor's rear axle, letting vehicles ride over the cab) averaging 5.5 miles per gallon. It runs 1,000 loaded miles plus 10% deadhead (empty miles driven to reach the next pickup) while carrying eight vehicles.
For scale, the ATRI (American Transportation Research Institute — the trucking industry's research organization) put the average cost of running a truck at $2.260 per mile in 2024, with fuel at about 21% of that. The two-week spike alone equals roughly 4.5% of that total. ATRI's figure covers all trucking, though, and car haulers typically carry heavier, less aerodynamic loads than the average truck, so fuel usually takes a bigger bite.
Fuel economy decides how hard a spike hits. The same 56-cent increase costs $0.112 per mile at 5.0 mpg and $0.094 at 6.0 mpg. At today's $6.529 national average, the total fuel gap between those two trucks is about 22 cents per mile, or roughly $21,800 over 100,000 miles.
That's why we think newer car carriers matter more now than at any point in recent years. Older trucks consistently burn more fuel, and when diesel sits at a record, that difference moves from a line item to a pricing problem. A carrier running older equipment has to charge more per mile or absorb a thinner margin on every load.
California diesel averaged $8.246 on September 21, compared with $6.177 on the Gulf Coast. On a 400-gallon fill, that's about $828 more at the pump. Most drivers heading into California fill their tanks before crossing the state line and buy only enough inside the state to get back out.
That workaround is fine for carriers who run California occasionally, as we do. Carriers with dedicated routes into or out of California can't avoid buying fuel there, so their costs rise faster. Shippers should expect West Coast lanes to reprice sooner and further than the national average suggests.
Record diesel doesn't take car haulers off the road nationally. It changes which loads they accept. That distinction matters because the two call for very different responses from shippers.
The headline logic runs like this: fuel costs spike, small carriers can't cover them, trucks park, and capacity disappears. So shippers tend to react in one of two ways. Some raise offers across every lane, which means overpaying on routes that were never at risk. Others hold their prices and wait, which leaves vehicles sitting on the routes that were. Both treat the market as one number.
The evidence points to selectivity. Auto Hauler Exchange's September 22 market note, from a single load-matching platform, described conditions that favored carriers, with some accepted offers clearing posted prices. It also reported that loads were still getting matched and that no lane showed acute scarcity. We found no public data from the past two weeks showing large numbers of car haulers parked or carriers abandoning routes.
Our own read of the general market fits the same pattern. Broker-offered pay has risen roughly 10–20%, depending on the route. If this were a national shortage, increases would be broad and even. A spread that wide means carriers are pricing each lane on its own economics.
In our experience, these lanes tighten first when fuel spikes:
Dense lanes with steady volume and reliable backhaul, such as high-volume plant-to-dealer routes, typically stay covered at market pay. The smarter move is to sort your lanes by exposure: pay up where a lane is genuinely thin, and hold firm where it isn't.
Shippers also have levers beyond price on thin lanes. Grouping several vehicles from the same origin into one release raises load density and lowers fuel cost per vehicle, though it can add a few days of wait. In our experience, a wider pickup window helps just as much, because it lets a carrier fit your vehicles into a route that already has a load going back.
On spot moves, the fuel increase shows up in the quote the same week. On contracted freight, it arrives weeks later through a surcharge. Knowing which you're looking at explains most of the sticker shock.
Spot moves usually have no separate fuel line. The cost is built into the all-in price per vehicle, so it reprices as soon as the pump does. That affects dealership moves like dealer trades and auction purchases most, since they're often booked spot. We'll be direct: on spot moves, we have no choice but to pass the fuel increase through. A carrier quoting spot freight at last month's rates is absorbing the difference, and that rarely lasts.
Contracts work differently. Most use an FSC (fuel surcharge — a line item that adjusts carrier pay as a published fuel index moves). The EIA publishes the index but doesn't set or regulate surcharges. Each contract defines its own base price, index, and reset schedule, and resets often trail the index by a week or more. One public example: Proficient Auto Logistics disclosed that a March 2026 fuel spike cost it roughly $1 million in the first quarter because its surcharge indexes didn't reset until April. Even well-built contracts lag.
Many surcharge formulas follow the same basic logic: take the current index price, subtract the contract's base price, and divide by an agreed miles-per-gallon figure. In a hypothetical contract with a $4.00 base and a 5.5 mpg divisor, the September 21 national price would produce a surcharge of about 46 cents per mile. The details vary by contract, but the lag built into that weekly or monthly reset is where carriers carry the cost in the meantime.
The practical takeaway is to compare total carrier pay, not base rates. A contract base rate and a spot all-in price aren't the same thing, and during a spike the gap between them is mostly fuel timing.
The most likely path over the next month is an elevated plateau, not a return to summer prices. Here's how each scenario would play out and what to watch in the weekly data.
Elevated plateau (most likely). Prices stop climbing but stay near record levels. Contract invoices keep rising for a few weeks as lagged surcharges catch up, and thin and West Coast lanes stay slow. Watch for the EIA national average holding within about 15 cents for two or three weekly releases.
Continued rise. Middle East flows worsen or refineries run lower. Each extra 50 cents per gallon adds about 9 cents per mile at 5.5 mpg, and carriers turn down marginal freight more aggressively. Watch for two more weekly increases, distillate stocks falling below 105 million barrels, or refinery utilization dropping below 92%.
Reversal. Tanker traffic normalizes and inventories rebuild. Spot prices ease first, and contract surcharges follow on their reset schedule. Watch for two straight weekly declines totaling more than 25 cents and distillate stocks climbing above 110 million barrels.
Seasonal volume could sharpen any of these. Model-year launches and fourth-quarter dealer, auction and remarketing activity typically add volume in the fall, which gives carriers more room to choose the lanes that pay.
The reverse case matters too. If fall vehicle volumes come in soft, surcharges will still push invoices higher while base rates stay flat. That squeezes carrier margins, and squeezed carriers become even more selective about thin lanes.
We're an asset-based carrier headquartered in West Lafayette, Indiana. We own and operate our trucks, so we control equipment and scheduling directly rather than relying on third parties. We invest in newer car carriers, which matters more when every mile costs more. Clients can track each load and its VINs in real time, and every client works with a named account manager. If a lane is tightening, you hear it from a person before a pickup window slips.
Why do car-hauling quotes change week to week during a diesel spike?
Spot quotes include fuel in the all-in price, and the EIA updates its national diesel price every Monday. Carriers reprice against the latest pump prices, and lanes with little return freight reprice the most because they carry the most empty miles.
Will my contracted rates go up right away?
Typically not. Base rates change slowly, and fuel surcharges adjust on the schedule your contract sets, often a week or more behind the index. That means the increase can show up on invoices after pump prices have already leveled off.
Which lanes are most likely to see delays?
Low-density pickups, destinations with little backhaul, lots with long loading times, and West Coast routes. Dense, high-volume lanes usually stay covered, though at higher market pay.
Record diesel is real, expensive, and unlikely to fade this month. But it's showing up as a pricing problem that varies lane by lane, not as a national shortage of trucks. Shippers who treat the market as one number will overpay on strong lanes and stall on weak ones. Those who sort their lanes by exposure will spend less and wait less.
Before your next round of bookings, pull your upcoming moves and flag the thin ones: single-vehicle pickups, destinations with little return freight, slow-release lots, and West Coast routes. Those are the loads to raise with your carrier now, before they sit. If you'd like a second opinion, talk through your lanes with our team.
Stay informed on the latest news and insights from GB Cargo.