The OEM Summer Shutdown in 2026. Diesel at $5.40 Meets a Time-Shifted Freight Trough
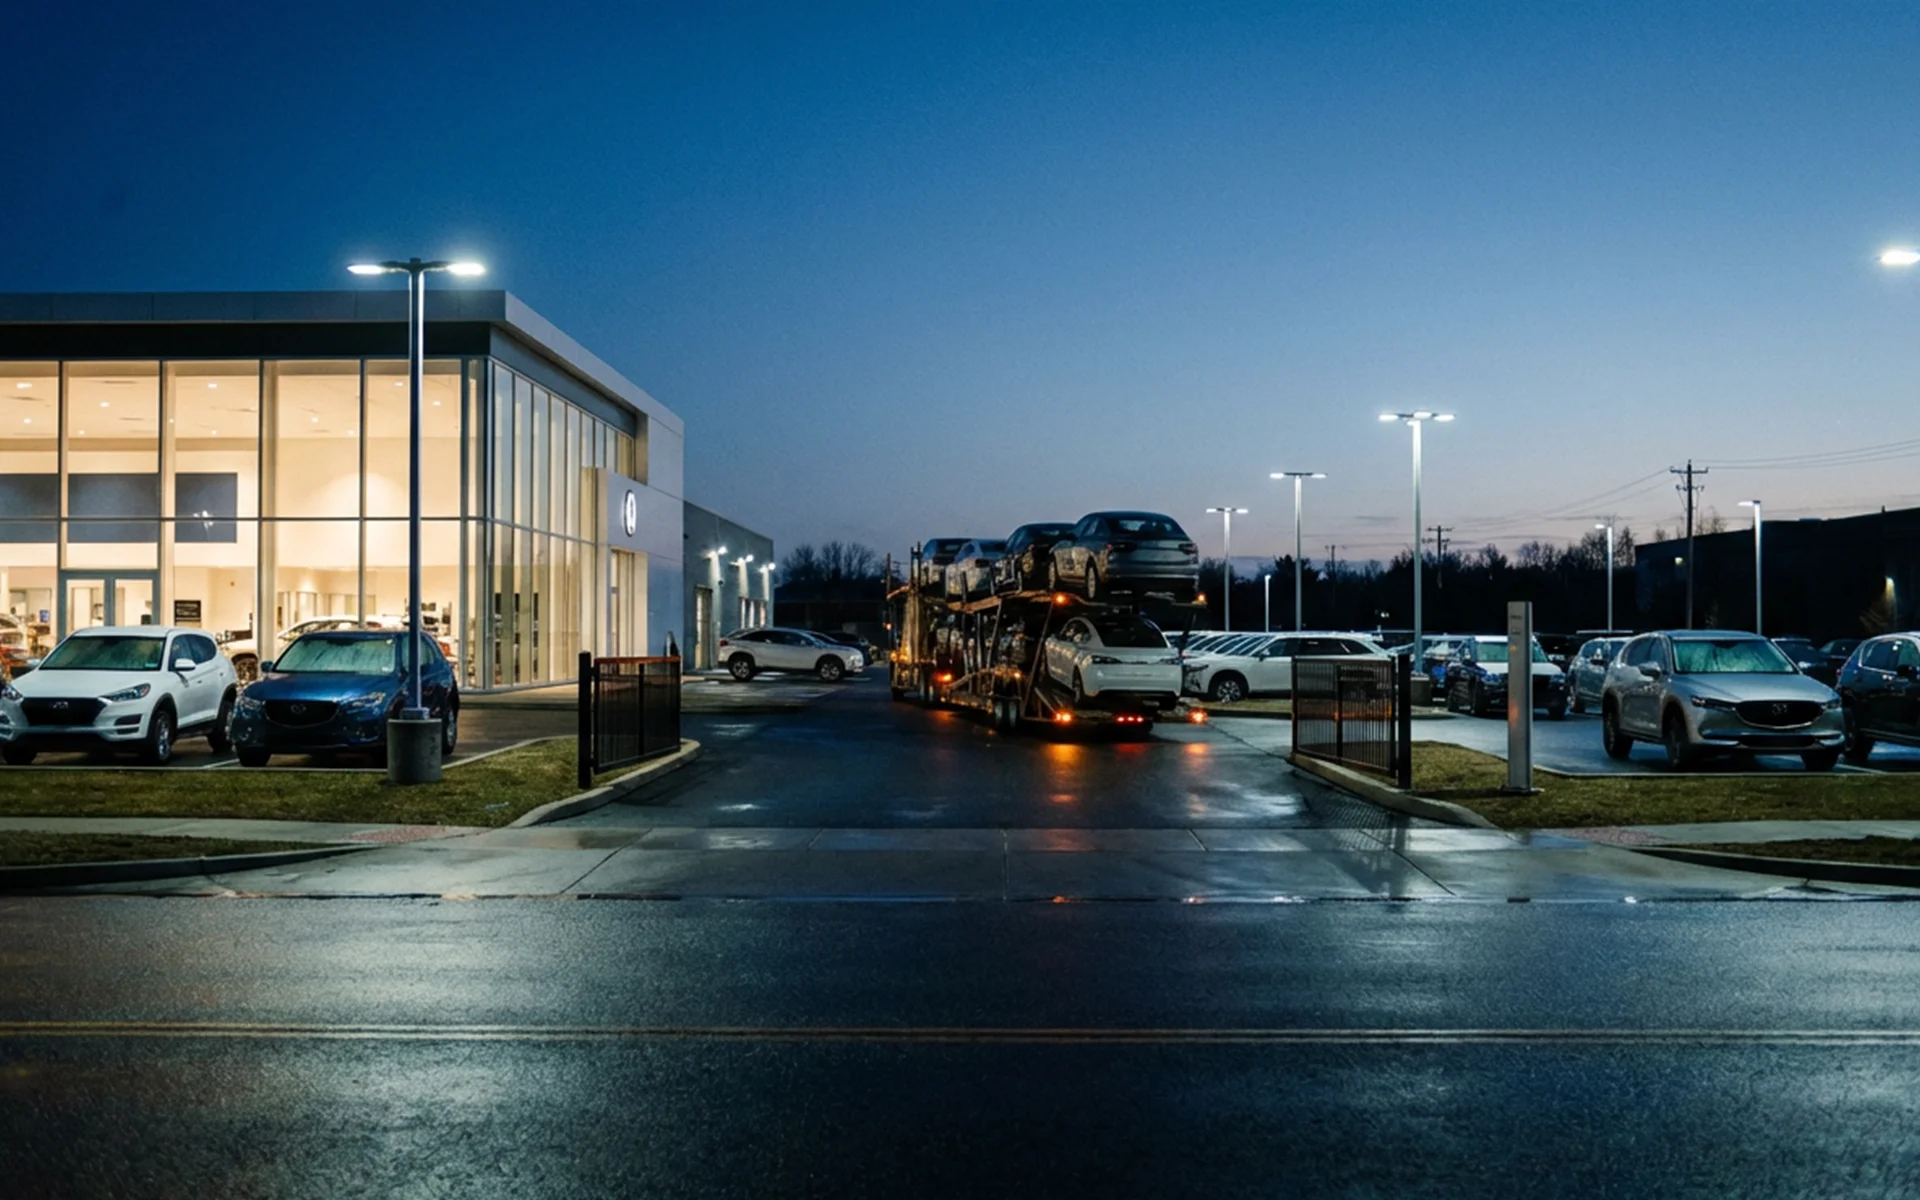
The OEM summer shutdown isn't a freight off-switch. The trough lags production by a week or two, colliding with diesel still elevated after the 2026 Iran shock.
The OEM summer shutdown is not a freight off-switch.
Yet most carriers treat it like one. They watch the calendar march toward the July 4th holiday, stage equipment for a dry spell, and brace for the volume to vanish the week the lines go quiet. Then the slowdown doesn’t come — not yet — and they’ve burned the calendar fighting a trough that hadn’t started.
The genuine trough arrives one to two weeks after production stops, and it leads the restart by similar intervals. Peak carrier pain rarely lands on the holiday weekend. And in 2026, it collides with diesel running roughly $1.45 per gallon above where most of us budgeted in January — the aftermath of a supply shock no forecaster saw coming.
This article maps how the OEM (Original Equipment Manufacturer — the vehicle maker) summer shutdown actually moves outbound freight, why the timing trips up carriers who model it as instantaneous, and how the 2026 diesel environment sharpens an already-tight margin window. It is written for the people who live inside that window: dispatchers, owner-operators, and anyone managing OEM-origin new-vehicle haul.
North American assembly plants don’t idle in midsummer by accident. Three structural forces land on the same seasonal moment, which is exactly why the late-June-to-mid-July window has stayed so stable for decades.
Model-year changeover is the deepest driver. The U.S. industry runs on an annual model year stretching roughly from October of the prior year through July or August. Moving to the next year forces plants to retool — adjusting jigs, reconfiguring body-in-white fixtures (the welded vehicle frame before paint), reprogramming robots, requalifying tooling, and integrating new components. On most platforms that work can’t run while the line is producing, so the line has to stop. How long depends on the platform: a carry-over model with minor sheet-metal changes needs far less downtime than a ground-up redesign.
Scheduled maintenance is the second driver. High-speed assembly accumulates wear that can’t all be fixed on the fly. Conveyors, paint-booth equipment, welding robots, and overhead rail systems need overhaul work that demands full-line shutdowns. General Motors has described its own historical practice as roughly two weeks of summer downtime to perform semi-annual maintenance and prepare for the new model year. Maintenance deferred past that window doesn’t disappear — it accumulates into reliability risk in the fourth quarter.
Production smoothing completes the trinity. Summer is a strong retail season overall, but the weeks bracketing July 4th are among the softest for dealership foot traffic. Inventory built through spring, combined with holiday-week softness, lets OEMs pull supply temporarily without creating dealer stock-outs. The shutdown is timed to fall where its cost in lost production is lowest.
None of this is new. The two-week midsummer shutdown traces back decades, to when automakers idled plants for model changeover in late June and early July — a practice that hardened into an annual ritual. UAW (United Auto Workers — the union representing autoworkers) contracts formalized it: agreements with GM, Ford, and Stellantis give the automakers until roughly June 1 to notify members whether the shutdown will proceed and on what schedule. The 2023 contracts, negotiated after the union’s historic simultaneous strike at all three Detroit automakers, kept that framework intact.
Flexible manufacturing has shortened the shutdown without killing it. Mixed-model lines, rapid-exchange tooling, and shared platforms have compressed changeover downtime, and modern plants can switch between product variants within a shift rather than over multiple days. Ford committed after 2013 to expanding that flexibility, targeting an average of four different models on each platform.
The result is less downtime and more variance — not the end of the practice. The evidence sits in the repeated cycle since 2010, when strong demand pushed automakers to cancel or shorten shutdowns: GM in 2010, the Big Three largely in 2013, Ford and others in 2015, and again in 2021. Soft-demand years ran the other way, stretching shutdowns well beyond two weeks.
What was once a fixed two-week event has become a variable one — anchored at the July 4th week but capable of shrinking to a single week or expanding past five. Flexible manufacturing made shutdowns discretionary and demand-responsive, not obsolete.
That distinction matters more than it first appears. If “the shutdown” were a single industry-wide event, every carrier on OEM lanes would feel it identically. It isn’t. Any given July shows a patchwork of plant statuses — some idled two weeks, some one, some running straight through. As we’ll see, that patchwork is the reason carrier exposure varies so widely from one book of business to the next.
In 2026, July 4th falls on a Saturday, bracketing the shutdown window between the weeks of June 29–July 3 and July 6–10. The domestic template — GM, Ford, Stellantis — has historically been two full calendar weeks across the June 28 to July 11 range, though some facilities run a rolling schedule that starts as early as mid-June.
Transplant automakers run shorter. Japanese-, Korean-, and German-owned U.S. plants have historically taken about one week centered on July 4th rather than the domestic two. In a representative recent year, Toyota shut all 14 of its North American plants for a single week in mid-July, Honda took downtime in early July, and Kia and Nissan idled from late June into the first week of July. The full range runs from one week — transplants, or anyone in a high-demand stretch — to two or three weeks for domestics under normal or soft conditions.
The variation tracks vehicle segment with striking consistency. Pickup and high-demand SUV plants are the repeated exception. In 2021, GM kept its Indiana and Texas truck plants running through July. In 2015, Ford trimmed its shutdown to one week at its Chicago, Kansas City, Kentucky Truck, and Louisville SUV plants. Profitable, high-volume truck and SUV facilities get priority for compressed or canceled downtime; car and midsize sedan plants absorb the longer shutdowns when demand is soft.
A second split shapes the calendar: changeover plants versus carry-over plants. A facility launching an entirely new generation essentially can’t shorten its shutdown below the retooling minimum, even in a strong market. A carry-over plant may need only minimal maintenance downtime. That’s why any single July week shows a mix of plant statuses rather than an industry-wide on/off.
The most notable 2026 departure is Ford’s decision to cancel summer shutdowns at all four of its F-Series assembly plants — Dearborn Truck, Kentucky Truck, Kansas City Assembly, and Ohio Assembly — to ramp production and recover roughly 50,000 trucks lost to an aluminum supply disruption from plant fires the prior fall. Those plants will run without the traditional summer break. GM’s full 2026 schedule hadn’t been announced in detail as of early June, but the baseline expectation is the standard two-week framework with truck-plant exceptions consistent with history. For carriers, the F-Series call carries a direct consequence: lanes serving Dearborn, Kentucky Truck, and Kansas City won’t see the typical July volume reduction that Ford’s car plants will.
The common mental model — production off-switch equals freight off-switch — is wrong, and the error costs carriers real money. The actual pattern only makes sense when you disaggregate it into four overlapping phases. Get the timing right and you stage equipment for the trough that’s coming; get it wrong and you brace for a slowdown a week or two before it arrives.
Outbound volume usually rises before a shutdown, not falls. OEMs and their logistics teams know the date months ahead, which creates a systematic incentive to accelerate production in the weeks before the line stops — to meet near-term dealer orders and to soften the supply gap the shutdown will open. Plants on three-shift schedules sometimes add weekend production or overtime in the two to four weeks prior. Industry analysis of seasonal freight describes carriers preparing by positioning equipment where demand will surge, staging trucks near assembly plants or railheads that release heavy inventory in June and July. The practical effect is a front-loaded spike in late June: heavier call on capacity, not lighter.
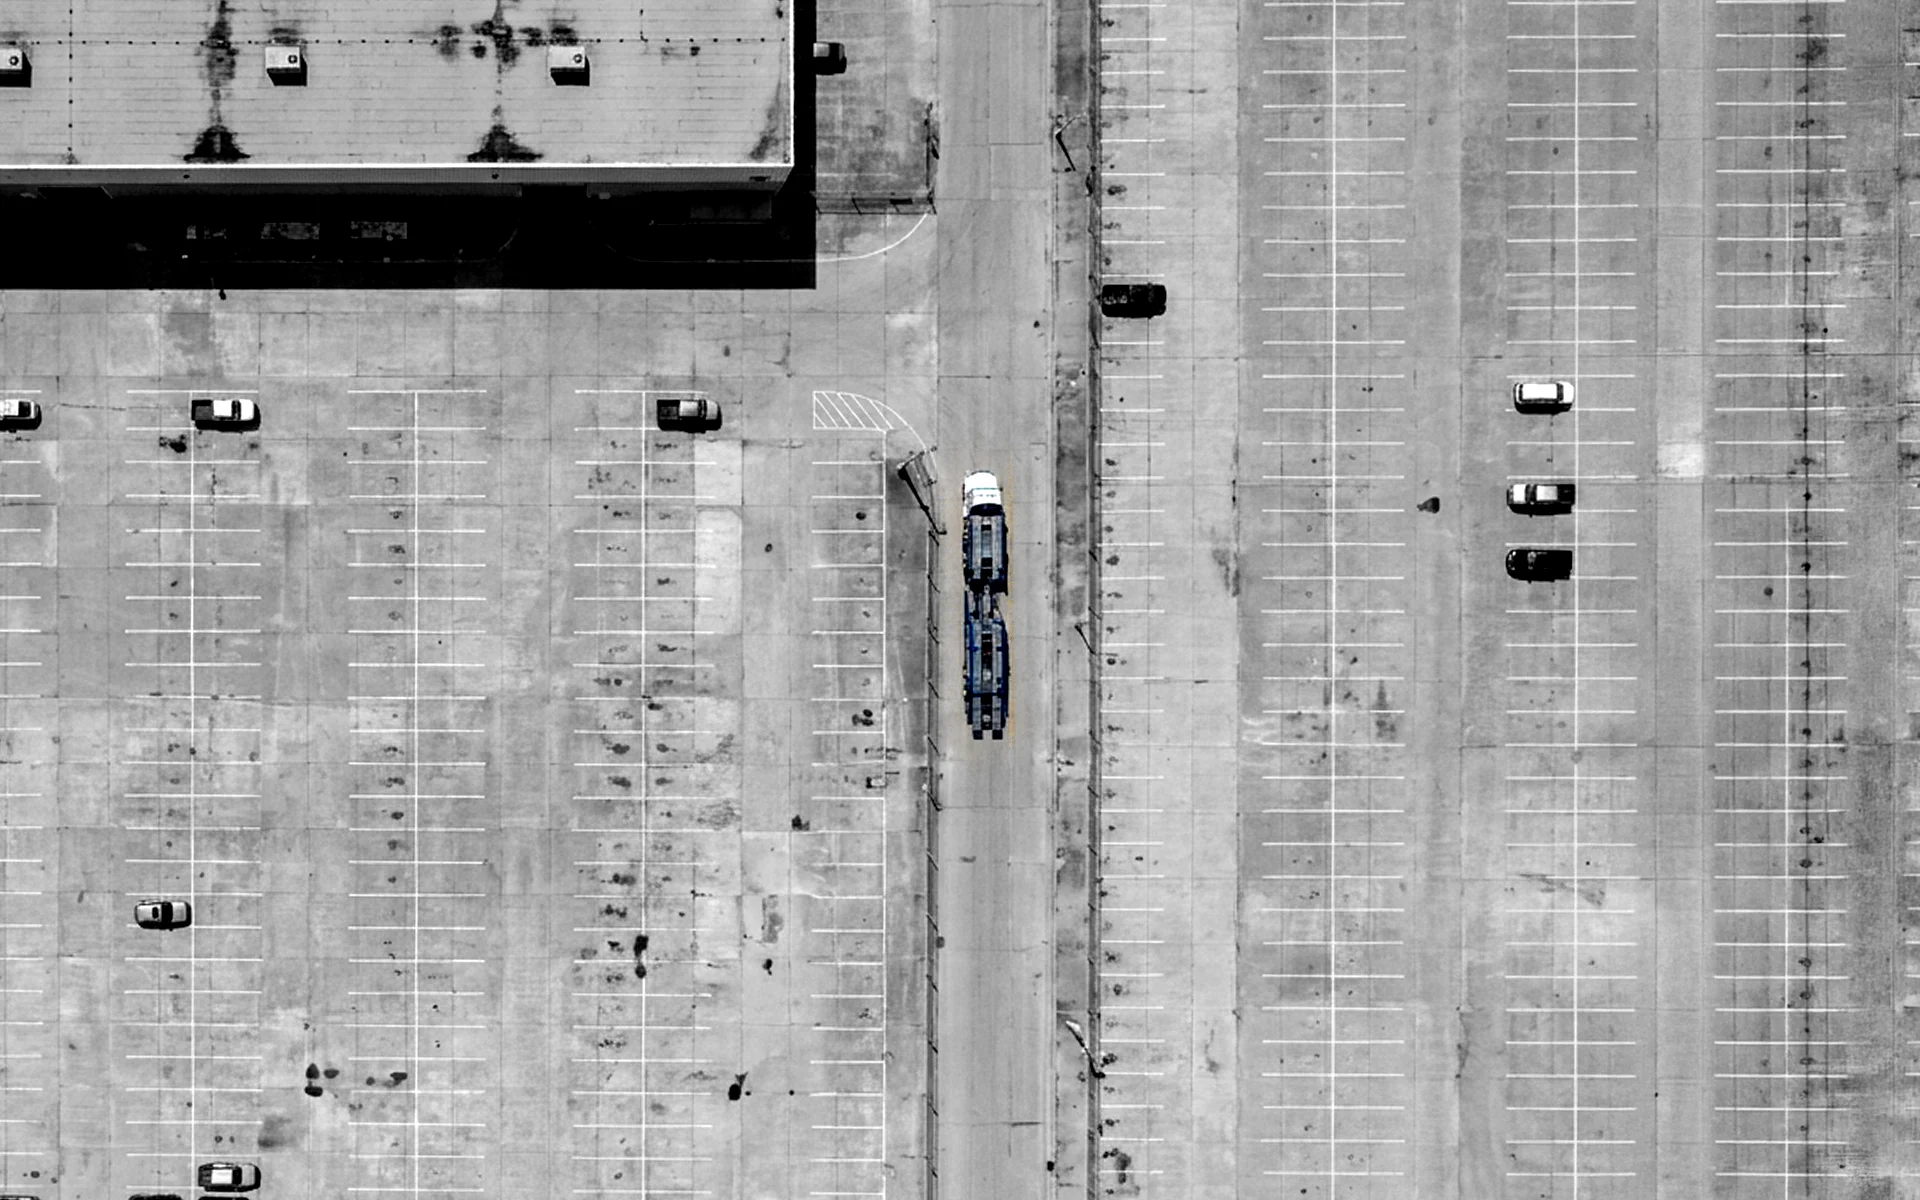
When the line stops, the vehicles already built don’t vanish — they keep flowing through the pipeline for days or weeks. Finished-vehicle logistics runs through multiple physical buffers between the line and the dealer lot: the plant compound for on-site holding, the VPC or VDC (Vehicle Processing Center or Vehicle Distribution Center — where finished vehicles are prepped and staged), rail transload yards, and regional staging areas. The sequence — plant compound to processing center to rail yard to hauler staging to dealer — means vehicles built in the final days before shutdown continue moving well after the line goes cold.
Industry descriptions of this pipeline emphasize its depth, tracing VIN (Vehicle Identification Number) movement from in-yard through processing and outbound staging, and noting that processing centers see workload peaks and troughs as carriers arrive to collect loads. The buffer typically sustains one to two weeks of continued outbound flow. The first week of a shutdown often still sees strong movement as the lot drains; it’s the second week — or later, for large-footprint plants — that freight genuinely thins.
The trough arrives when the pipeline empties — lots largely cleared, processing centers caught up on pre-shutdown vehicles, and the line still silent. For most plants that point lands roughly one to two weeks after the shutdown begins and persists through the rest of the closure and into the restart ramp. This is when the supply reduction bites: load availability on OEM-origin lanes drops, carriers positioned near those plants find fewer loads, and the risk of empty repositioning miles climbs.
The critical detail is the lag. The trough trails the production stop by days to weeks and leads the restart by similar intervals, which means peak carrier pain doesn’t necessarily align with the July 4th weekend. It may arrive the following week, once the lots are genuinely drained and no restart has yet begun.
Lines don’t snap back to full output the morning after a two-week shutdown. Restart is a gradual ramp — confirming tooling changes, qualifying new suppliers for any model-year part changes, retraining operators, and rebuilding rhythm. That ramp generates its own freight dynamic: a wave of outbound volume once new-model shipments begin, with August and September often bringing a concentrated surge as new model-year vehicles flow to dealers. This is the fall-launch peak car-haul carriers have to prepare for.
Stated cleanly, the pattern runs: elevated load before the shutdown, continued flow as the lots drain, a genuine trough of typically one to three weeks, a gradual restart ramp, and then the fall-launch surge. It is not a clean shutoff. But the trough in the middle is real, and its effect on carrier economics is too.
The 2026 diesel environment bears no resemblance to what was forecast at the start of the year. In late 2025, every major forecaster — including the EIA (U.S. Energy Information Administration — the federal agency that tracks energy prices) — expected U.S. on-highway diesel to average roughly $3.43 to $3.66 per gallon in 2026, modestly below 2025, on the assumption that a global oil surplus would hold crude in the mid-$50s per barrel.
That forecast collapsed in late February, when the U.S.-Israeli conflict with Iran effectively closed the Strait of Hormuz — the chokepoint for roughly one-fifth of the world’s oil and gas — and triggered a supply shock of historic scale. The EIA later assessed that six Gulf producers collectively shut in 10.5 million barrels per day of crude in April, with global oil inventories drawing down at 8.5 million barrels per day in the second quarter. Brent crude peaked at $138 per barrel on April 7. Diesel surged with it.
The before-and-after is stark. The EIA had forecast diesel averaging $3.41 per gallon in the second quarter; the actual quarterly average ran north of $5.60 — roughly $2.20 per gallon above the pre-conflict forecast. The weekly trajectory shows how violently it moved: from $3.809 on February 23 to $4.859 on March 9, a jump of more than a dollar a gallon in a single week, peaking at $5.643 in early April before easing to $5.350 by June 1.
Here’s the part that matters for the summer window: diesel is declining into the shutdown period, not climbing into it. The June 1 level sits about $1.45 per gallon above where the year started and roughly $1.55 above the same week in 2025 — but it’s well off the April–May peak. The squeeze argument, as we’ll lay out, does not depend on diesel rising. It depends on diesel staying dramatically elevated relative to the baseline carriers were pricing into their operations in January.
Regional spread is a real cost variable
Car-haul lanes are inherently regional, and diesel varies sharply across the PADDs (Petroleum Administration for Defense Districts — the regional zones the EIA uses for fuel data). The numbers as of June 1, 2026:
For a Midwest carrier — PADD 2, the densest region for domestic OEM assembly — the June 1 price of $5.392 compares to $3.798 at the February low and around $3.50 in the same week of 2025. Gulf Coast carriers serving the Alabama and Texas transplant corridors sit lower at $4.900, still well above year-ago levels. The spread is meaningful before lane distance or load density even enters the math: a carrier on Midwest OEM lanes simply pays more per mile than one on Gulf Coast transplant lanes.
The EIA’s May 2026 outlook projects diesel averaging $4.94 per gallon in the third quarter, the July-through-September window that contains the shutdown. That’s an easing from the second-quarter peak, and it rests on a specific assumption: that Strait of Hormuz traffic begins resuming in June and shut-in Middle Eastern production gradually returns. The agency itself cautions that supply normalization likely won’t reach pre-conflict levels until later in the year. In plain terms, the easing scenario is real but geopolitically contingent — delivery quotes built on third-quarter relief carry forecast risk the EIA has openly acknowledged.
The squeeze isn’t about either factor alone — it’s about both arriving together. To see why, start with the cost structure a car-haul carrier carries regardless of how many loads it runs.
The latest ATRI (American Transportation Research Institute) analysis, covering 2024 data, put the average carrier’s total marginal cost at $2.260 per mile. The composition is the key. Truck and trailer payments at $0.390 per mile (a record high), driver wages at $0.798, benefits at $0.197, and insurance at $0.102 (also a record) together account for roughly $1.49 per mile — about 66% of total operating cost. These are almost entirely fixed in the short run. Equipment financing doesn’t shrink when freight falls, insurance is paid whether the truck is loaded or empty, and drivers carry minimum-hour expectations once employed. Fuel, at $0.481 per mile in 2024, was the main variable component — and even it has a floor, because an empty repositioning trip still burns diesel.
The 2026 fuel math is worth making concrete. On a truck running 120,000 miles a year, the gap between $3.50 and $5.40 diesel — about $2.00 a gallon, at the roughly 6 miles per gallon a loaded multi-car hauler gets carrying eight to ten vehicles — works out to about $0.33 in added cost per loaded mile. Across 120,000 annual miles, that’s roughly $40,000 per truck in additional fuel cost.
The squeeze materializes through a simple lever: fixed costs spread across loads. During the trough, load availability on OEM lanes falls, but the fixed costs don’t fall with it — so the cost per delivered vehicle rises. The arithmetic is stark. A truck that normally delivers 40 vehicles a week (four or five multi-car loads) and drops to 25 during the trough sees its fixed-cost component per vehicle climb by roughly 60% for that stretch. Costs didn’t go up; they’re just spread over fewer units.
Our own operating profile makes the mechanism easy to picture. We run a standard nine-car hauler and move well over 100 vehicles a week in one direction on our core corridors. When weekly delivered units fall on a given lane, every fixed dollar — the equipment payment, the insurance, the driver’s guaranteed hours — lands on fewer vehicles, which is exactly how a quiet two-week stretch turns into a per-unit cost spike even when nothing about the cost base has changed.
The trough sharpens a second structural cost: empty repositioning miles. Car-haul routes run from plants and rail yards to dealer networks, and the directionality is one-way — vehicles move plant-to-dealer, rarely the reverse. Backhaul is structurally limited even in normal conditions; industry-wide, one in three trucks runs empty, generating an estimated 61 billion empty miles a year. When plant-adjacent lanes go thin during the trough, a carrier either waits, incurring time cost, or repositions empty to a market with better loads — both of which erode margin. A book weighted toward auction freight and retail moves, with different directional flows, gives equipment somewhere productive to go when one lane dries up.
This is precisely the cost our lane design is built to fight. We route in triangles across our Illinois–South Florida, Texas, California, and New York corridors specifically to build return-load density between hubs, so equipment isn’t repositioning empty out of a draining plant lane. A carrier’s routing structure doesn’t make the trough disappear, but it determines how much of the trough converts into unpaid empty miles.
For 2026, the squeeze comes in two phases that interact across the calendar. Phase A — the Iran-shock surge from February to May, already behind us — hit carriers who entered the year with diesel near $3.50 and surcharge thresholds calibrated to a $3.00–$3.50 baseline. The surge to $5.64 imposed an unbudgeted increase of roughly $0.35 to $0.38 per loaded mile, and because surcharges typically compute on the prior period’s benchmark, carriers ran partially underwater until the mechanism caught up.
Phase B is the shutdown trough overlapping still-elevated diesel in July. At the EIA’s projected $4.94 per gallon, fuel sits about $1.44 above January and $1.40 above the same period in 2025. For a Midwest carrier at PADD 2 prices, each deadhead mile costs roughly $0.90 in fuel alone at 6 mpg, against about $0.58 a year ago. Fewer loads to absorb fixed costs, more empty miles, and each of those miles more expensive — compression from two directions at once.
Here’s the part most discussions of the summer shutdown miss: how hard July hits a carrier is determined less by the shutdown itself than by the carrier’s own book of business. Two variables decide it — the share of the book that’s OEM-origin new-vehicle haul, and how concentrated that exposure is in specific plants and lanes.
A carrier whose freight is predominantly OEM outbound from a handful of domestic Midwest plants feels the trough intensely. A carrier diversified across used-vehicle moves, auction freight, retail transport, and cross-country relocation feels it far less, because those segments follow different seasonal rhythms and don’t dip in the same week. The industry’s broader summer relocation peak doesn’t rescue a carrier that’s geographically and contractually committed to plant-origin lanes — but it does cushion one whose book is spread across segments, including dedicated fleet work.
That’s the lens we’d apply to our own exposure. Our work is finished-vehicle delivery across retail, dealership, and auction demand on the Illinois–South Florida, Texas, California, and New York corridors — not a high-concentration book anchored to a single plant’s outbound schedule. That diversification is why a July trough is something we plan around rather than dread. It isn’t luck; it’s a book composition that doesn’t put all of July’s volume on one plant’s lights.
This is the spiky truth worth sitting with: blaming July margin pain on “the shutdown” is the lazy read. The shutdown is a fixed, knowable input — the dates are negotiated months ahead and the patterns are decades old. The variables that actually decide whether July hurts — book composition, lane concentration, and surcharge discipline — are the ones the carrier controls. A carrier that gets squeezed in July wasn’t ambushed by the shutdown. It was exposed by its own structure.
There are honest limits to the thesis. Flexible manufacturing is shortening shutdowns at more plants, and with light-vehicle sales running at a 16-million-plus SAAR (Seasonally Adjusted Annual Rate — a standardized measure of sales pace) pace, more facilities may compress their downtime in 2026, which would blunt the trough. Steady dealer inventories push OEMs to restart fast, shortening the trough from the back end. And surcharge mechanisms genuinely do offset much of the fuel cost over a sustained elevation like 2026’s — by July, most surcharge tables should have converged on the higher price level, leaving Phase B better protected than the acute Phase A surge. The squeeze is real and directionally significant. It is not a cliff, and it is worst for exactly the carriers whose structure leaves them most exposed.
We’re an asset-based carrier running a fleet of 40-plus modern car carriers — we own and operate our equipment rather than brokering it to third parties. Our standard nine-car haulers (with capacity for ten-car stinger configurations) move well over 100 vehicles a week in one direction on our core corridors: Illinois to South Florida on a four-day transit benchmark, plus Texas, California, and New York, with triangle routing between hubs. Every B2B client works with a dedicated account manager rather than a rotating dispatch queue, and follows shipment status through real-time tracking from pickup to delivery.
When does the OEM summer shutdown actually hit car-haul volume in 2026?
Later than most carriers expect. The genuine trough trails the production stop by one to two weeks, because vehicles built before the shutdown keep flowing through plant lots and processing centers after the line goes quiet. For domestic plants taking a full two-week shutdown, the sharpest volume drop typically lands in the second and third weeks of July, not the holiday week itself.
Are all OEM plants down for the same length of time?
No. Domestic plants have historically taken about two weeks, transplants about one, and profitable truck and SUV plants are frequently exempted or compressed. In 2026, Ford has canceled summer shutdowns at all four of its F-Series plants to recover lost truck production, so carriers on those lanes won’t see the usual July dip at all.
Does elevated 2026 diesel mean carriers are unprotected?
Only partly exposed. Most OEM and broker contracts tie fuel surcharges to a weekly DOE (Department of Energy) diesel benchmark, so sustained high prices pull surcharge payments up to offset much of the cost. The gap is timing — surcharges lag fast price moves by a few weeks, which left carriers underwater during February’s spike. By July, with prices elevated for months, most surcharge tables should have caught up.
The OEM summer shutdown is structural, knowable, and time-shifted — three things that, taken together, should make it one of the most plannable events on a car-haul calendar rather than one of the most disruptive. The carriers who struggle in July aren’t undone by the shutdown so much as by their own concentration and surcharge posture, both of which sit within their control. In 2026, an elevated-but-easing diesel environment sharpens the trough without rising into it — which means the carriers who model the real timing and structure their book accordingly will navigate the window that catches less-prepared operators flat.
The single most useful thing a carrier can do before July is map its own book’s OEM-origin concentration against the specific plants on its lanes, then overlay the four-phase timeline — pre-shutdown push, lot drain, genuine trough, restart ramp — onto that map. Staging equipment for the holiday week is staging for the wrong week. The operators who protect margin position for the trough’s actual arrival, a week or two later, and build enough lane diversity to keep equipment loaded when any single plant goes dark. If you’d like to compare notes on how we structure corridor routing to absorb seasonal troughs, our team is easy to reach.
Stay informed on the latest news and insights from GB Cargo.