For OEM (Original Equipment Manufacturer) leaders, Finished Vehicle Logistics (FVL) is not just a cost line. It is a moving extension of the plant, the dealer network, and ultimately the brand. When outbound flows are stable, production plans hold, dealers stay supplied, and customers receive the vehicles they expect. When they are not, the impact is visible from factory yards all the way to the boardroom.
Across programs and vehicle lines, three priorities tend to define how OEM executives and plant logistics managers judge a finished vehicle logistics partner: plant evacuation efficiency, damage-free delivery ratio, and lead time achievement. Together, these KPIs show whether a carrier is supporting or straining the OEM’s broader strategy.
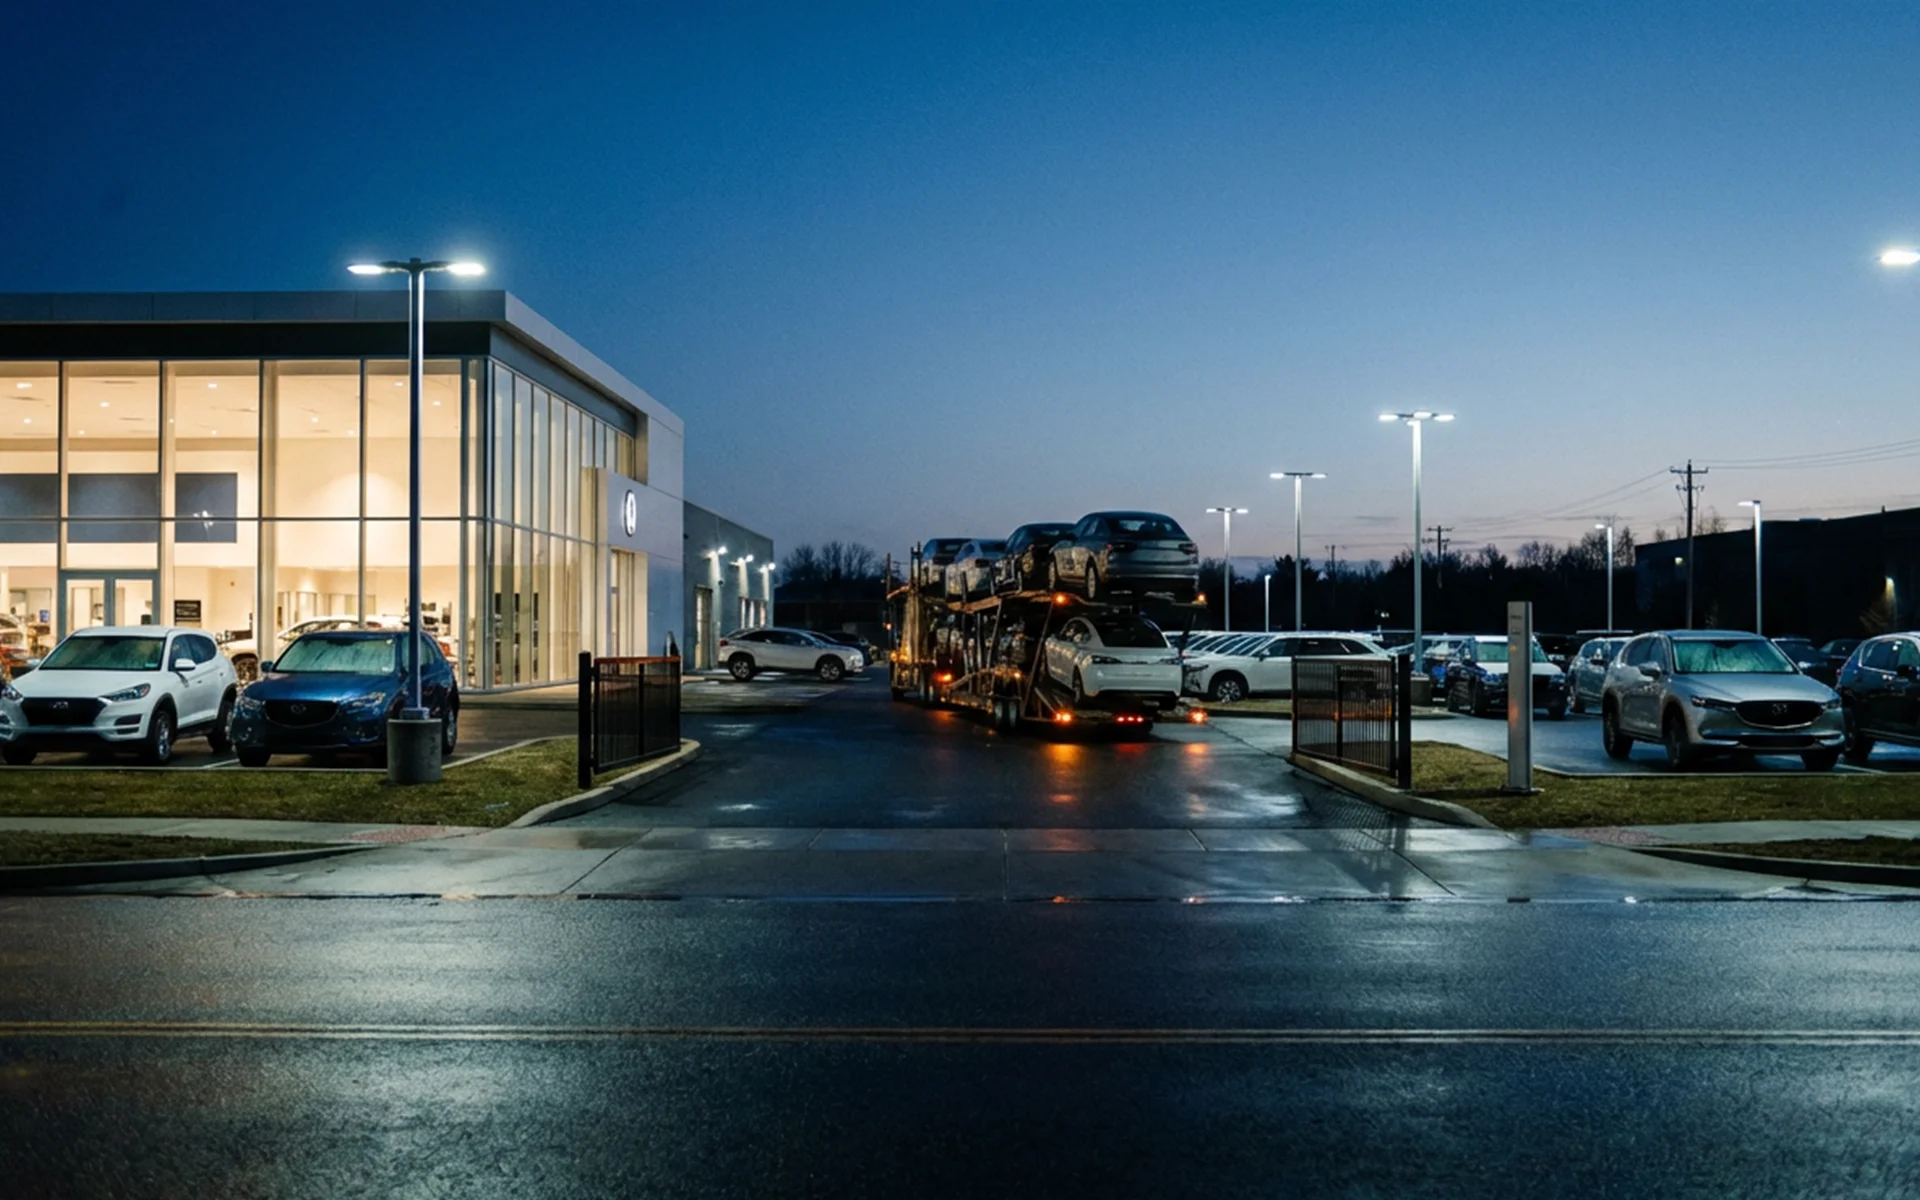
In this article, we look at these priorities from an OEM perspective and explain how our team, as an asset-based car-hauling carrier serving the lower 48 states, structures our operations around them.
How OEM Executives View Finished Vehicle Logistics Today
Inside OEMs, FVL is increasingly treated as a strategic function. It connects stable, high-investment production assets with volatile market demand, evolving dealer expectations, and tight customer delivery promises. Outbound logistics is expected to absorb shocks from rail, ports, weather, and labor while still presenting a stable picture to the rest of the organization.
At the executive level, leaders focus on questions such as:
- Are we protecting our production plan, or are outbound bottlenecks forcing expensive slowdowns?
- Are we protecting our brand, or are transport-related damages and missed lead times undermining customer confidence?
- Are we managing total cost, or are storage, rework, and expediting eating up the savings from a low linehaul rate?
At the plant logistics level, teams face a different reality. They manage yard congestion, handoffs from the line to the transport yard, gate operations, and daily coordination with carriers. For them, the key questions are:
- Are vehicles leaving the plant within the agreed window once they are ready for transport?
- Are trucks arriving and departing on time, with minimal disruption to plant and yard operations?
- Are damages rare, documented, and handled in a structured way?
That is why OEM contracts and quarterly business reviews tend to revolve around a small set of KPIs. Plant evacuation, damage-free delivery, and lead time achievement turn high-level objectives into measurable performance, and they are the lens through which carriers are evaluated.
Plant Evacuation Efficiency — Keeping Yards Moving and Lines Flowing
Why Plant Evacuation Is a Board-Level Concern
Plant evacuation efficiency is often treated as a local, operational issue, but its impact reaches far beyond the yard. When outbound vehicles do not leave on schedule, yards fill up quickly. Space becomes constrained, vehicle handling increases, and plant teams are forced to manage around congestion instead of focusing on smooth production.
If this persists, OEMs may be forced to slow down line rates, change sequencing, or rely on additional storage, all of which carry direct and indirect costs. Dealers may see delays in receiving inventory, especially on new models or critical trims. Executive teams see the results as increased working capital and growing pressure on production planning.
For that reason, many OEMs define plant evacuation efficiency as a central KPI. It is less about one truck arriving a few hours late and more about the consistent ability to keep yards in balance and production protected.
How OEMs Commonly Define and Track Plant Evacuation
In practice, plant evacuation often comes down to a simple relationship between “Ready For Transport” (RFT) and actual pickup by the carrier. The most common forms of measurement include:
- Target dwell windows — for example, evacuating vehicles within 24–48 hours from RFT to dispatch, depending on the OEM and the specific plant agreement.
- Percentage of units evacuated within that window — sometimes broken down by day of week, model line, or lane.
These measures typically live inside OEM dashboards and scorecards. They show up in regular operational calls and quarterly reviews, and they directly influence sourcing decisions and allocation of volume among carriers. A partner that cannot keep dwell times within agreed windows, especially during volume spikes, will be flagged quickly.
How We Support Plant Evacuation Across the Lower 48
As an asset-based car-hauling company serving OEM programs across the lower 48 states, we structure our operations to align with each OEM’s evacuation targets and yard realities.
We work around a few core practices:
- Plant-specific evacuation agreements
We collaborate with OEM teams to understand their production cadence and yard capacity, then align on realistic dwell targets. Where the agreement specifies a 24–48 hour window from RFT to pickup, we aim to stay within that band as consistently as possible. - Pre-planned capacity and flexible routing
Because we operate our own fleet, we can plan capacity around known production patterns and adjust when volumes shift. New launches, seasonal peaks, and regional demand spikes can be supported with pre-arranged surge capacity and route adjustments. - Coordinated scheduling with plant and yard teams
We work with plant logistics and yard operations to schedule truck arrivals and departures in ways that minimize congestion at gates and loading areas. That coordination is essential to keep trucks turning and avoid local bottlenecks that ripple back into the plant.
In short, our goal is to keep plant evacuation performance in line with what we have agreed together with each OEM. Being asset-based allows us to make routing and capacity decisions directly, rather than relying on third-party carriers to execute.
Damage-Free Delivery Ratio — Protecting the Brand at Every Mile
Why 99% Damage-Free Is the Benchmark, Not the Exception
While units leaving the plant on time is critical, it matters just as much what condition they are in when they arrive at their destination. Transport-related damages have a direct impact on cost and a longer-term impact on brand.
Every damaged vehicle represents additional inspection, documentation, repair time, and potential delays before the dealer can deliver it to a customer. On high-visibility vehicles or launches, even a small number of transport damages can feel disproportionate. They also affect dealer confidence: if a dealer expects issues on arrival, that shapes orders and customer conversations.
For these reasons, OEMs pay close attention to damage-free delivery ratio. Many OEMs expect performance around 99% damage-free, especially on core programs and premium vehicles, and they benchmark carriers against each other based on this metric.
What OEMs Look For Behind a Strong Damage-Free Ratio
Damage-free performance is measured at arrival, but OEMs also look behind the numbers. They ask:
- How consistent are origin and destination inspections?
- How well documented are condition reports, photos, and exception notes?
- How quickly and transparently are claims handled when something goes wrong?
- Are there recognizable patterns in where and when damages occur, and are corrective actions implemented?
A low damage rate without credible process behind it is unlikely to earn long-term trust. OEMs want to see both a strong ratio and a robust approach to preventing and handling damages.
Our Approach to Damage Prevention and Documentation
Across our OEM work, our performance is around 99% damage-free on transported vehicles. That outcome is supported by several operational practices we apply consistently across our fleet:
- Standardized origin and destination inspections
Our drivers follow structured checklists during loading and unloading. Where required, we capture photos and digital condition reports that can be shared with OEM teams. This reduces ambiguity and supports faster resolution if exceptions occur. - Newer, well-maintained car-hauling equipment
As an asset-based carrier, we invest in maintaining our trailers and tractors at a high standard. Consistent equipment specification and maintenance reduce the risk of damage caused by mechanical issues or non-standard setups. - Focused driver training and model-specific awareness
Our drivers are trained not only on loading and securement techniques, but also on OEM-specific guidelines and model sensitivities. That training is reinforced through supervision, coaching, and feedback loops based on inspection and claims data. - Structured claims handling
When an issue does occur, we follow a documented process: acknowledge quickly, gather the relevant inspection records and photos, coordinate with the OEM contact, and move toward resolution. The goal is to maintain transparency and keep vehicles moving through the repair and delivery process.
Behind these practices, we maintain robust carrier insurance appropriate for OEM programs. We do not lead the conversation with insurance, but it is there to support the operational standards we set.
Lead Time Achievement — Keeping Dealer Promises Credible
How OEMs Define Lead Time and On-Time Performance
Lead time achievement is the delivery-side counterpart to plant evacuation. It measures how consistently vehicles reach their next node or final destination within the agreed time window. OEMs define lead times by lane and node — for example, plant to dealer, plant to rail ramp, or port to dealer — and they track how often shipments arrive on time.
From an OEM perspective, this KPI ties directly into:
- Dealer inventory and allocation planning
Dealers plan marketing, staffing, and customer commitments around expected arrivals. Late or unpredictable shipments create friction throughout the network. - Launch and campaign timing
For new models or key campaigns, missed lead times can disrupt carefully sequenced rollouts and customer communications. - Customer satisfaction and brand experience
When a customer has a promised delivery window, the OEM and dealer rely on outbound logistics to support that promise.
Lead time achievement is typically measured as a percentage of vehicles delivered within the agreed window, rather than as an average. This keeps the focus on reliability, not just speed.
Factors That Threaten Lead Time — and How OEMs Expect Partners to Respond
Many of the risks to lead time sit outside the OEM’s direct control: severe weather, infrastructure disruptions, local traffic issues, rail or port congestion, and unexpected volume spikes. OEM executives know these factors exist and generally do not expect them to disappear.
What they do expect is that their carriers:
- Monitor conditions proactively and flag risks before they become surprises.
- Propose workarounds or re-sequencing where possible to protect the overall plan.
- Communicate clearly when a delay is unavoidable, with realistic recovery options.
A partner who treats disruptions as occasional excuses rather than operational challenges will quickly fall out of favor.
How We Structure Our Network Around Lead Time Achievement
On our side, we focus on building lead time performance into how we plan and operate, rather than treating it as an after-the-fact metric.
That means:
- Designing routes and capacity around agreed lead times
We plan our lanes, schedules, and driver assignments around the lead time expectations set with each OEM. The goal is not just to hit a target once, but to do it consistently over time. - Balancing efficiency and reliability
We look for ways to optimize routing and truck utilization without compromising agreed transit windows. Where choices arise, we favor reliability on committed programs. - Managing disruptions with proactive communication
When external factors threaten lead times, our teams inform OEM contacts and, where appropriate, dealer teams. We focus on what can be protected, what may need to be resequenced, and how to minimize knock-on effects.
Because we operate nationwide across the lower 48 states, we can support multi-region OEM programs with a consistent approach to lead time achievement, even when lanes and volumes change.
Visibility, Reporting, and Governance — Turning KPIs into Action
What OEM Executives Expect from a Modern FVL Partner
Plant evacuation, damage-free delivery, and lead time achievement are only as useful as the visibility behind them. OEM leaders increasingly expect real-time and near real-time insight into their networks, not just periodic summary reports.
Key expectations include:
- VIN-level visibility — the ability to see where vehicles are, which stage of transport they are in, and what exceptions exist.
- Lane and program-level scorecards — clear KPIs by lane, program, or plant, so trends and outliers can be addressed.
- Structured governance — regular operational calls and quarterly business reviews where data informs decisions, not just anecdotes.
A carrier’s ability to provide this visibility often becomes a deciding factor when OEMs select long-term partners.
How We Monitor and Report Plant Evacuation, Damage, and Lead Time
We have shaped our approach to visibility and governance around these expectations:
- VIN-level real-time tracking through our portal
For OEM programs, we provide VIN-level tracking links so authorized users can see the current status of each vehicle. This reduces back-and-forth emails and gives plants and network planners a clearer view of what is in transit. - Dedicated account management for OEM programs
We assign a dedicated account manager as a primary point of contact for each OEM program. That person coordinates day-to-day communication, KPI discussions, and escalations, ensuring that information flows in both directions. - Regular KPI reporting aligned to OEM scorecards
We provide reporting on plant evacuation performance, damage-free ratios, and lead time achievement, and we align our format to each OEM’s preferred scorecards wherever possible. This makes it easy to integrate our data into internal dashboards and reviews.
Being asset-based supports this visibility. Because we control the trucks, drivers, and many of the underlying processes, the data we share reflects our own operations rather than a patchwork of third-party inputs.
Why Asset-Based Matters for OEM KPIs
Direct Control Over Capacity and Standards
“Asset-based” is more than a label in our industry. For OEMs, it signals that the carrier owns and operates the equipment and employs the drivers who move their vehicles. That structure has a direct impact on the KPIs that executives care about.
With our own fleet, we can:
- Allocate and shift capacity based on plant-specific needs, production changes, and new programs.
- Maintain consistent equipment standards, ensuring trailers are configured and maintained to OEM expectations.
- Apply uniform training and operating procedures across drivers, so plant evacuation, damage prevention, and lead time practices are consistent across lanes.
In contrast, a purely brokerage-based model may rely on a rotating pool of third-party carriers with varied standards, equipment, and processes. That can introduce variability into the very KPIs OEMs want to stabilize.
Connecting Asset-Based Operations to Each KPI
The advantages of an asset-based model show up directly in the three OEM priorities:
- Plant evacuation efficiency
With direct control over trucks and schedules, we can prioritize plants and lanes where dwell time pressure is highest. We can adjust routes and allocate additional capacity more quickly when production ramps up or when certain plants need relief. - Damage-free delivery ratio
Standardized equipment, training, and procedures reduce the risk of transport-related damage. Fewer handoffs and more consistent processes support our around 99% damage-free performance. - Lead time achievement
By managing routes, departure times, and driver dispatch directly, we can design our operation around agreed lead times and react faster when conditions change.
For OEM executives and plant logistics managers, working with an asset-based partner is one way to de-risk outbound operations while maintaining flexibility in the network.
FAQ
How do you adapt plant evacuation targets for different OEMs and plants?
We align plant evacuation targets with each OEM’s specific requirements and production patterns. For plants that operate with a 24–48 hour RFT-to-pickup window, we plan capacity and scheduling to stay within that range whenever possible and review performance regularly with local and central teams.
Can you support multi-plant or multi-region OEM programs across the lower 48 states?
Yes. We operate across the lower 48 states and can support programs that span multiple plants, regions, and dealer networks. We design routes and fleet allocations to reflect each OEM’s lane structure and adjust as those networks evolve.
How do you handle exceptions when weather or infrastructure issues threaten lead times?
When external events put lead times at risk, we focus on early communication and practical options. Our account managers inform OEM contacts, explain the likely impact, and work on adjustments such as resequencing loads or prioritizing certain lanes to protect the broader plan.
What kind of visibility and reporting can OEM executives expect on their vehicles and KPIs?
OEM teams receive VIN-level tracking links through our portal and regular KPI reports covering plant evacuation, damage-free performance, and lead time achievement. We also offer dedicated account management and structured review meetings to turn these metrics into actionable decisions.
Conclusion
For OEM leaders, Finished Vehicle Logistics is a key link between the factory, the dealer network, and the customer. While rate per mile will always matter, the real test of a carrier is its performance on three core priorities: plant evacuation efficiency, damage-free delivery, and lead time achievement.
Our team focuses on these KPIs in the way we design, operate, and govern our OEM programs. By combining an asset-based fleet, nationwide coverage across the lower 48 states, strong damage prevention practices, and VIN-level visibility, we aim to support OEM production plans, protect brand reputation, and keep dealer commitments credible.
Closing — Next steps
If you are responsible for outbound vehicle logistics at an OEM, a practical next step is to look at your current KPIs and where they fall short of your targets. How often are plants running close to yard capacity, how stable are your damage-free ratios, and how reliable is lead time performance across regions?
From there, it may be helpful to compare what you see internally with what you expect from an asset-based finished vehicle logistics partner. Our team can walk through your current network, discuss your program-specific goals, and explore how an asset-based approach to plant evacuation, damage prevention, and lead time achievement can support your next phase of growth.